DIRECTV 2007 Annual Report Download - page 62
Download and view the complete annual report
Please find page 62 of the 2007 DIRECTV annual report below. You can navigate through the pages in the report by either clicking on the pages listed below, or by using the keyword search tool below to find specific information within the annual report.-
 1
1 -
2
-
3
-
4
-
5
-
6
-
7
-
8
-
9
-
10
-
11
-
12
-
13
-
14
-
15
-
16
-
17
-
18
-
19
-
20
-
21
-
22
-
23
-
24
-
25
-
26
-
27
-
28
-
29
-
30
-
31
-
32
-
33
-
34
-
35
-
36
-
37
-
38
-
39
-
40
-
41
-
42
-
43
-
44
-
45
-
46
-
47
-
48
-
49
-
50
-
51
-
 52
52 -
 53
53 -
 54
54 -
 55
55 -
 56
56 -
 57
57 -
 58
58 -
 59
59 -
 60
60 -
 61
61 -
 62
62 -
 63
63 -
 64
64 -
 65
65 -
 66
66 -
 67
67 -
 68
68 -
 69
69 -
 70
70 -
 71
71 -
 72
72 -
73
-
74
-
75
-
76
-
77
-
78
-
79
-
80
-
81
-
82
-
83
-
84
-
85
-
86
-
87
-
88
-
89
-
90
-
91
-
92
-
93
-
94
-
95
-
96
-
97
-
98
-
99
-
100
-
101
-
102
-
103
-
104
-
105
-
106
-
107
-
108
-
109
-
110
-
111
-
112
-
113
-
114
-
115
-
116
-
117
-
118
-
119
-
120
-
121
-
122
-
123
-
124
-
125
-
126
-
127
-
128
-
129
-
130
-
131
-
132
-
133
-
134
-
135
 |
 |

THE DIRECTV GROUP, INC.
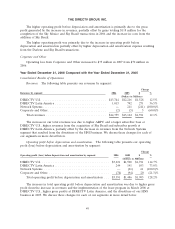
The increase in revenues in 2006 compared to 2005 primarily resulted from the $205 million of
added revenues from the acquisition of our interest in Sky Brazil in August 2006 and the increase in
the number of subscribers.
The improvement in operating profit before depreciation and amortization and operating profit
was primarily due to gains totaling $118 million for the completion of the Sky Mexico and Sky Brazil
transactions in 2006, and an increase in gross profit resulting from the increase in revenues, partially
offset by the $70 million gain recorded during 2005, also related to the Sky Mexico transaction, and a
$11 million charge recorded in 2006 for the disposal of fixed assets.
The increase in operating profit was primarily due to the increase in operating profit before
depreciation and amortization.
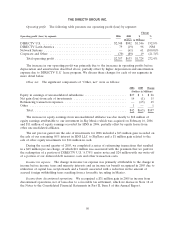
Network Systems Segment
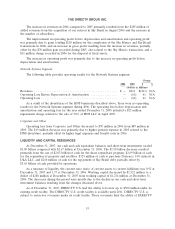
The following table provides operating results for the Network Systems segment:
Change
2006 2005 $ %
(Dollars in Millions)
Revenues ............................................... $ — $211 $(211) N/A
Operating Loss Before Depreciation & Amortization ............... — (61) 61 N/A
Operating Loss ........................................... — (61) 61 N/A
As a result of the divestitures of the HNS businesses described above, there were no operating
results for the Network Systems segment during 2006. The operating loss before depreciation and
amortization and operating loss for the year ended December 31, 2005 included a $25 million
impairment charge related to the sale of 50% of HNS LLC in April 2005.
Corporate and Other
Operating loss from Corporate and Other decreased to $70 million in 2006 from $89 million in
2005. The $19 million decrease was primarily due to higher pension expense in 2005 related to the
HNS divestiture, partially offset by higher legal expenses and benefit costs in 2006.
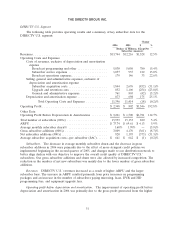
LIQUIDITY AND CAPITAL RESOURCES
At December 31, 2007, our cash and cash equivalent balances and short-term investments totaled
$1.09 billion compared with $2.67 billion at December 31, 2006. The $1.58 billion decrease resulted
primarily from the use of $2.03 billion of cash for the share repurchase program, $2.69 billion of cash
for the acquisition of property and satellites, $325 million of cash to purchase Darlene’s 14% interest in
DLA LLC, and $210 million of cash for the repayment of Sky Brazil debt, partially offset by
$3.65 billion of cash provided by operations.
As a measure of liquidity, the current ratio (ratio of current assets to current liabilities) was 0.92 at
December 31, 2007 and 1.37 at December 31, 2006. Working capital decreased by $1,522 million to a
deficit of $288 million at December 31, 2007 from working capital of $1,234 million at December 31,
2006. The decreases during the period were mostly due to the decline in our cash and short-term
investment balances resulting from the changes discussed above.
As of December 31, 2007, DIRECTV U.S. had the ability to borrow up to $500 million under its
existing credit facility. The DIRECTV U.S. credit facility is available until 2011. DIRECTV U.S. is
subject to restrictive covenants under its credit facility. These covenants limit the ability of DIRECTV
53