DIRECTV 2007 Annual Report Download - page 123
Download and view the complete annual report
Please find page 123 of the 2007 DIRECTV annual report below. You can navigate through the pages in the report by either clicking on the pages listed below, or by using the keyword search tool below to find specific information within the annual report.-
 1
1 -
2
-
3
-
4
-
5
-
6
-
7
-
8
-
9
-
10
-
11
-
12
-
13
-
14
-
15
-
16
-
17
-
18
-
19
-
20
-
21
-
22
-
23
-
24
-
25
-
26
-
27
-
28
-
29
-
30
-
31
-
32
-
33
-
34
-
35
-
36
-
37
-
38
-
39
-
40
-
41
-
42
-
43
-
44
-
45
-
46
-
47
-
48
-
49
-
50
-
51
-
52
-
53
-
54
-
55
-
56
-
57
-
58
-
59
-
60
-
61
-
62
-
63
-
64
-
65
-
66
-
67
-
68
-
69
-
70
-
71
-
72
-
73
-
74
-
75
-
76
-
77
-
78
-
79
-
80
-
81
-
82
-
83
-
84
-
85
-
86
-
87
-
88
-
89
-
90
-
91
-
92
-
93
-
94
-
95
-
96
-
97
-
98
-
99
-
100
-
101
-
102
-
103
-
104
-
105
-
106
-
107
-
108
-
109
-
110
-
111
-
112
-
 113
113 -
 114
114 -
 115
115 -
 116
116 -
 117
117 -
 118
118 -
 119
119 -
 120
120 -
 121
121 -
 122
122 -
 123
123 -
 124
124 -
 125
125 -
 126
126 -
 127
127 -
 128
128 -
 129
129 -
 130
130 -
 131
131 -
 132
132 -
 133
133 -
134
-
135
 |
 |

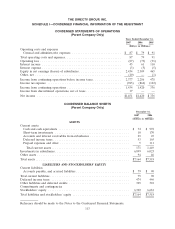
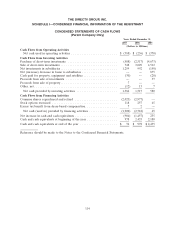
THE DIRECTV GROUP, INC.
SCHEDULE I—CONDENSED FINANCIAL INFORMATION OF THE REGISTRANT
CONDENSED STATEMENTS OF CASH FLOWS
(Parent Company Only)
Years Ended December 31,
2007 2006 2005
(Dollars in Millions)
Cash Flows from Operating Activities
Net cash used in operating activities .......................... $ (388) $ (256) $ (370)
Cash Flows from Investing Activities
Purchase of short-term investments ............................ (588) (2,517) (4,673)
Sale of short-term investments ................................ 748 3,029 4,512
Net investments in subsidiaries ................................ 1,259 992 (150)
Net (increase) decrease in loans to subsidiaries .................... — — 875
Cash paid for property, equipment and satellites ................... (30) — (28)
Proceeds from sale of investments .............................——37
Proceeds from sale of property ................................ 7 — —
Other, net ............................................... (12) 13 7
Net cash provided by investing activities ....................... 1,384 1,517 580
Cash Flows from Financing Activities
Common shares repurchased and retired ........................ (2,025) (2,977) —
Stock options exercised ..................................... 118 257 45
Excess tax benefit from share-based compensation .................. 7 2 —
Net cash (used in) provided by financing activities ................ (1,900) (2,718) 45
Net increase in cash and cash equivalents ........................ (904) (1,457) 255
Cash and cash equivalents at beginning of the year ................. 978 2,435 2,180
Cash and cash equivalents at end of the year ..................... $ 74 $ 978 $2,435
Reference should be made to the Notes to the Condensed Financial Statements.
114