DIRECTV 2007 Annual Report Download - page 100
Download and view the complete annual report
Please find page 100 of the 2007 DIRECTV annual report below. You can navigate through the pages in the report by either clicking on the pages listed below, or by using the keyword search tool below to find specific information within the annual report.-
 1
1 -
2
-
3
-
4
-
5
-
6
-
7
-
8
-
9
-
10
-
11
-
12
-
13
-
14
-
15
-
16
-
17
-
18
-
19
-
20
-
21
-
22
-
23
-
24
-
25
-
26
-
27
-
28
-
29
-
30
-
31
-
32
-
33
-
34
-
35
-
36
-
37
-
38
-
39
-
40
-
41
-
42
-
43
-
44
-
45
-
46
-
47
-
48
-
49
-
50
-
51
-
52
-
53
-
54
-
55
-
56
-
57
-
58
-
59
-
60
-
61
-
62
-
63
-
64
-
65
-
66
-
67
-
68
-
69
-
70
-
71
-
72
-
73
-
74
-
75
-
76
-
77
-
78
-
79
-
80
-
81
-
82
-
83
-
84
-
85
-
86
-
87
-
88
-
89
-
 90
90 -
 91
91 -
 92
92 -
 93
93 -
 94
94 -
 95
95 -
 96
96 -
 97
97 -
 98
98 -
 99
99 -
 100
100 -
 101
101 -
 102
102 -
 103
103 -
 104
104 -
 105
105 -
 106
106 -
 107
107 -
 108
108 -
 109
109 -
 110
110 -
111
-
112
-
113
-
114
-
115
-
116
-
117
-
118
-
119
-
120
-
121
-
122
-
123
-
124
-
125
-
126
-
127
-
128
-
129
-
130
-
131
-
132
-
133
-
134
-
135
 |
 |

THE DIRECTV GROUP, INC.
NOTES TO THE CONSOLIDATED FINANCIAL STATEMENTS—(continued)
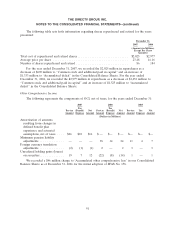
The following table sets forth information regarding shares repurchased and retired for the years
presented:
December 31,
2007 2006
(Amounts in Millions,
Except Per Share
Amounts)
Total cost of repurchased and retired shares ............................. $2,025 $2,977
Average price per share ........................................... 23.48 16.16
Number of shares repurchased and retired .............................. 86 184
For the year ended December 31, 2007, we recorded the $2,025 million in repurchases as a
decrease of $692 million to ‘‘Common stock and additional paid in capital’’ and an increase of
$1,333 million to ‘‘Accumulated deficit’’ in the Consolidated Balance Sheets. For the year ended
December 31, 2006, we recorded the $2,977 million in repurchases as a decrease of $1,452 million to
‘‘Common stock and additional paid in capital’’ and an increase of $1,525 million to ‘‘Accumulated
deficit’’ in the Consolidated Balance Sheets.
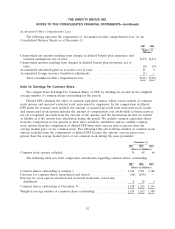
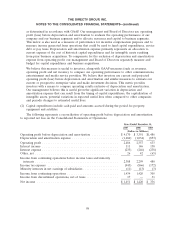
Other Comprehensive Income
The following represents the components of OCI, net of taxes, for the years ended December 31:
2007 2006 2005
Tax Tax
Pre-tax (Benefit) Net Pre-tax (Benefit) Net Pre-tax Tax Net
Amount Expense Amount Amount Expense Amount Amount Expense Amount
(Dollars in Millions)
Amortization of amounts
resulting from changes in
defined benefit plan
experience and actuarial
assumptions, net of taxes .... $26 $10 $16 $— $— $— $— $— $—
Minimum pension liability
adjustments .............. — — — 38 14 24 11 4 7
Foreign currency translation
adjustments .............. (2) (1) (1) 2 — 2 3 — 3
Unrealized holding gains (losses)
on securities .............. 19 7 12 (22) (8) (14) 1 — 1
We recorded a $46 million charge to ‘‘Accumulated other comprehensive loss’’ in our Consolidated
Balance Sheets as of December 31, 2006 for the initial adoption of SFAS No. 158.
91