DIRECTV 2007 Annual Report Download - page 59
Download and view the complete annual report
Please find page 59 of the 2007 DIRECTV annual report below. You can navigate through the pages in the report by either clicking on the pages listed below, or by using the keyword search tool below to find specific information within the annual report.-
 1
1 -
2
-
3
-
4
-
5
-
6
-
7
-
8
-
9
-
10
-
11
-
12
-
13
-
14
-
15
-
16
-
17
-
18
-
19
-
20
-
21
-
22
-
23
-
24
-
25
-
26
-
27
-
28
-
29
-
30
-
31
-
32
-
33
-
34
-
35
-
36
-
37
-
38
-
39
-
40
-
41
-
42
-
43
-
44
-
45
-
46
-
47
-
48
-
 49
49 -
 50
50 -
 51
51 -
 52
52 -
 53
53 -
 54
54 -
 55
55 -
 56
56 -
 57
57 -
 58
58 -
 59
59 -
 60
60 -
 61
61 -
 62
62 -
 63
63 -
 64
64 -
 65
65 -
 66
66 -
 67
67 -
 68
68 -
 69
69 -
70
-
71
-
72
-
73
-
74
-
75
-
76
-
77
-
78
-
79
-
80
-
81
-
82
-
83
-
84
-
85
-
86
-
87
-
88
-
89
-
90
-
91
-
92
-
93
-
94
-
95
-
96
-
97
-
98
-
99
-
100
-
101
-
102
-
103
-
104
-
105
-
106
-
107
-
108
-
109
-
110
-
111
-
112
-
113
-
114
-
115
-
116
-
117
-
118
-
119
-
120
-
121
-
122
-
123
-
124
-
125
-
126
-
127
-
128
-
129
-
130
-
131
-
132
-
133
-
134
-
135
 |
 |

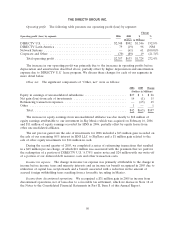
THE DIRECTV GROUP, INC.
Operating profit. The following table presents our operating profit (loss) by segment:
Change
Operating profit (loss) by segment: 2006 2005 $ %
(Dollars in Millions)
DIRECTV U.S. ....................................... $2,348 $802 $1,546 192.8%
DIRECTV Latin America ................................ 79 (19) 98 NM
Network Systems ...................................... — (61) 61 (100.0)%
Corporate and Other ................................... (70) (89) 19 (21.3)%
Total operating profit ................................ $2,357 $633 $1,724 272.4%
The increase in our operating profit was primarily due to the increases in operating profits before
depreciation and amortization described above, partially offset by higher depreciation and amortization
expense due to DIRECTV U.S.’ lease program. We discuss these changes for each of our segments in
more detail below.
Other, net. The significant components of ‘‘Other, net’’ were as follows:
2006 2005 Change
(Dollars in Millions)
Equity in earnings of unconsolidated subsidiaries ........................ $27 $ 1 $ 26
Net gain (loss) from sale of investments .............................. 14 (1) 15
Refinancing transaction expenses .................................... — (65) 65
Other ....................................................... 1 — 1
Total ..................................................... $42 $(65) $107
The increase in equity earnings from unconsolidated affiliates was due mostly to $18 million of
equity earnings attributable to our investment in Sky Mexico which was acquired on February 16, 2006
and $11 million of equity earnings recorded for HNS in 2006, partially offset by equity losses from
other unconsolidated affiliates.
The net pre-tax gain from the sale of investments for 2006 included a $13 million gain recorded on
the sale of our remaining 50% interest in HNS LLC to SkyTerra and a $1 million gain related to the
sale of other equity investments for $14 million in cash.
During the second quarter of 2005, we completed a series of refinancing transactions that resulted
in a $65 million pre-tax charge, of which $41 million was associated with the premium that we paid for
the redemption of a portion of DIRECTV U.S.’ 8.375% senior notes and $24 million with our write-off
of a portion of our deferred debt issuance costs and other transaction costs.
Income tax expense. The change in income tax expense was primarily attributable to the change in
income before income taxes and minority interests and an income tax benefit recognized in 2005 due to
utilization of capital loss carryforwards and a benefit associated with a reduction in the amount of
accrued foreign withholding taxes resulting from a favorable tax ruling in Mexico.
Income from discontinued operations. We recognized a $31 million gain in 2005 in income from
discontinued operations, net of taxes due to a favorable tax settlement, which we discuss in Note 18 of
the Notes to the Consolidated Financial Statements in Part II, Item 8 of this Annual Report.
50