DIRECTV 2007 Annual Report Download - page 60
Download and view the complete annual report
Please find page 60 of the 2007 DIRECTV annual report below. You can navigate through the pages in the report by either clicking on the pages listed below, or by using the keyword search tool below to find specific information within the annual report.-
 1
1 -
2
-
3
-
4
-
5
-
6
-
7
-
8
-
9
-
10
-
11
-
12
-
13
-
14
-
15
-
16
-
17
-
18
-
19
-
20
-
21
-
22
-
23
-
24
-
25
-
26
-
27
-
28
-
29
-
30
-
31
-
32
-
33
-
34
-
35
-
36
-
37
-
38
-
39
-
40
-
41
-
42
-
43
-
44
-
45
-
46
-
47
-
48
-
49
-
 50
50 -
 51
51 -
 52
52 -
 53
53 -
 54
54 -
 55
55 -
 56
56 -
 57
57 -
 58
58 -
 59
59 -
 60
60 -
 61
61 -
 62
62 -
 63
63 -
 64
64 -
 65
65 -
 66
66 -
 67
67 -
 68
68 -
 69
69 -
 70
70 -
71
-
72
-
73
-
74
-
75
-
76
-
77
-
78
-
79
-
80
-
81
-
82
-
83
-
84
-
85
-
86
-
87
-
88
-
89
-
90
-
91
-
92
-
93
-
94
-
95
-
96
-
97
-
98
-
99
-
100
-
101
-
102
-
103
-
104
-
105
-
106
-
107
-
108
-
109
-
110
-
111
-
112
-
113
-
114
-
115
-
116
-
117
-
118
-
119
-
120
-
121
-
122
-
123
-
124
-
125
-
126
-
127
-
128
-
129
-
130
-
131
-
132
-
133
-
134
-
135
 |
 |

THE DIRECTV GROUP, INC.
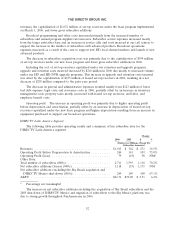
DIRECTV U.S. Segment
The following table provides operating results and a summary of key subscriber data for the
DIRECTV U.S. segment:
Change
2006 2005 $ %
(Dollars in Millions, Except Per
Subscriber Amounts)
Revenues .......................................... $13,744 $12,216 $1,528 12.5%
Operating Costs and Expenses
Costs of revenues, exclusive of depreciation and amortization
expense
Broadcast programming and other ................. 5,830 5,050 780 15.4%
Subscriber service expenses ...................... 1,057 935 122 13.0%
Broadcast operations expenses .................... 179 146 33 22.6%
Selling, general and administrative expenses, exclusive of
depreciation and amortization expense
Subscriber acquisition costs ...................... 1,844 2,676 (832) (31.1)%
Upgrade and retention costs ..................... 852 1,106 (254) (23.0)%
General and administrative expenses ............... 761 803 (42) (5.2)%
Depreciation and amortization expense ................. 873 698 175 25.1%
Total Operating Costs and Expenses ............ 11,396 11,414 (18) (0.2)%
Operating Profit ..................................... $ 2,348 $ 802 $1,546 192.8%
Other Data:
Operating Profit Before Depreciation & Amortization ......... $ 3,221 $ 1,500 $1,721 114.7%
Total number of subscribers (000’s) ....................... 15,953 15,133 820 5.4%
ARPU ............................................ $ 73.74 $ 69.61 $ 4.13 5.9%
Average monthly subscriber churn% ...................... 1.60% 1.70% — (5.9)%
Gross subscriber additions (000’s) ........................ 3,809 4,170 (361) (8.7)%
Net subscriber additions (000’s) .......................... 820 1,193 (373) (31.3)%
Average subscriber acquisition costs—per subscriber (SAC) ...... $ 641 $ 642 $ (1) (0.2)%
Subscribers. The decrease in average monthly subscriber churn and the decrease in gross
subscriber additions in 2006 were primarily due to the effect of more stringent credit policies we
implemented beginning in the second quarter of 2005, and changes made to our distribution network to
better align dealers with our objective to improve the overall credit quality of DIRECTV U.S.’
subscribers. Our gross subscriber additions and churn were also affected by increased competition. The
reduction in the number of net new subscribers was mainly due to the lower number of gross subscriber
additions.
Revenues. DIRECTV U.S.’ revenues increased as a result of higher ARPU and the larger
subscriber base. The increase in ARPU resulted primarily from price increases on programming
packages and an increase in the number of subscribers paying mirroring, lease, DVR and HD
programming fees, and equipment upgrade fees.
Operating profit before depreciation and amortization. The improvement of operating profit before
depreciation and amortization in 2006 was primarily due to the gross profit generated from the higher
51