DIRECTV 2007 Annual Report Download - page 57
Download and view the complete annual report
Please find page 57 of the 2007 DIRECTV annual report below. You can navigate through the pages in the report by either clicking on the pages listed below, or by using the keyword search tool below to find specific information within the annual report.-
 1
1 -
2
-
3
-
4
-
5
-
6
-
7
-
8
-
9
-
10
-
11
-
12
-
13
-
14
-
15
-
16
-
17
-
18
-
19
-
20
-
21
-
22
-
23
-
24
-
25
-
26
-
27
-
28
-
29
-
30
-
31
-
32
-
33
-
34
-
35
-
36
-
37
-
38
-
39
-
40
-
41
-
42
-
43
-
44
-
45
-
46
-
 47
47 -
 48
48 -
 49
49 -
 50
50 -
 51
51 -
 52
52 -
 53
53 -
 54
54 -
 55
55 -
 56
56 -
 57
57 -
 58
58 -
 59
59 -
 60
60 -
 61
61 -
 62
62 -
 63
63 -
 64
64 -
 65
65 -
 66
66 -
 67
67 -
68
-
69
-
70
-
71
-
72
-
73
-
74
-
75
-
76
-
77
-
78
-
79
-
80
-
81
-
82
-
83
-
84
-
85
-
86
-
87
-
88
-
89
-
90
-
91
-
92
-
93
-
94
-
95
-
96
-
97
-
98
-
99
-
100
-
101
-
102
-
103
-
104
-
105
-
106
-
107
-
108
-
109
-
110
-
111
-
112
-
113
-
114
-
115
-
116
-
117
-
118
-
119
-
120
-
121
-
122
-
123
-
124
-
125
-
126
-
127
-
128
-
129
-
130
-
131
-
132
-
133
-
134
-
135
 |
 |

THE DIRECTV GROUP, INC.
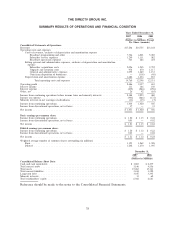
Broadcast programming and other costs increased due to annual program supplier rate increases
and the larger number of subscribers in 2007. Subscriber service expenses increased due to the larger
subscriber base in 2007. Broadcast operations expense increased in 2007 due primarily to costs to
support new HD local channel markets.
Subscriber acquisition costs increased due to higher advertising and direct sales marketing costs as
well as higher costs associated with the increase in subscribers taking advanced products in 2007. This
increase was partially offset by $159 million of higher costs in 2006 related to set top receivers being
expensed prior to the implementation of the lease program on March 1, 2006, after which most set-top
receivers were capitalized as well as lower set-top receiver costs. SAC per subscriber, which includes the
cost of capitalized set-top receivers, increased due to higher direct sales marketing and advertising costs
and higher costs associated with the increase in subscribers taking HD and DVR services, partially
offset by lower set top receiver costs.
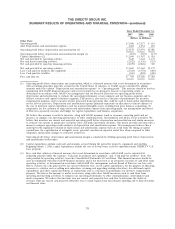
Upgrade and retention costs increased in 2007 due to higher volume of subscribers upgrading to
HD and DVR services, partially offset by $115 million of higher costs in 2006 related to set top
receivers being expensed prior to the implementation of the lease program and lower set top receiver
costs.
General and administrative expenses increased in 2007 due to higher labor, employee benefit, and
legal costs, partially offset by a $10 million reduction in bad debt expense compared to 2006.
Operating profit. The increase in operating profit was primarily due to higher operating profit
before depreciation and amortization, partially offset by higher depreciation and amortization expense
in 2007 resulting from the capitalization of set-top receivers under the lease program.
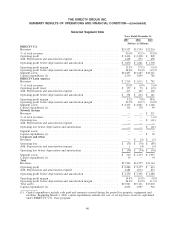
DIRECTV Latin America Segment
The following table provides operating results and a summary of key subscriber data for the
DIRECTV Latin America segment:
Change
2007 2006 $ %
(Dollars in Millions, Except Per
Subscriber Amounts)
Revenues ............................................ $1,719 $1,013 $ 706 69.7%
Operating profit before depreciation & amortization ............. 394 244 150 61.5%
Operating profit (loss) ................................... 159 79 80 101.3%
Other data:
Total number of subscribers (000’s) .......................... 3,279 2,711 568 21.0%
Net subscriber additions (000’s) ............................ 568 1,118 (550) NM*
Net subscriber additions (excluding the Sky Brazil acquisition) (000’s) . 568 249 319 128.1%
ARPU .............................................. $48.33 $41.71 $6.62 15.9%
* Percentage not meaningful
The increase in net subscriber additions, excluding the Sky Brazil acquisition in 2006, was primarily
due to subscriber growth in Brazil, Argentina, Venezuela and Colombia, as well as a decrease in churn
in Brazil and Venezuela.
The increase in revenues primarily resulted from a $527 million increase in revenue in Brazil
primarily due to the acquisition of Sky Brazil in August 2006, higher ARPU and favorable exchange
rates, as well as subscriber and ARPU growth in PanAmericana.
48