DIRECTV 2007 Annual Report Download - page 108
Download and view the complete annual report
Please find page 108 of the 2007 DIRECTV annual report below. You can navigate through the pages in the report by either clicking on the pages listed below, or by using the keyword search tool below to find specific information within the annual report.-
 1
1 -
2
-
3
-
4
-
5
-
6
-
7
-
8
-
9
-
10
-
11
-
12
-
13
-
14
-
15
-
16
-
17
-
18
-
19
-
20
-
21
-
22
-
23
-
24
-
25
-
26
-
27
-
28
-
29
-
30
-
31
-
32
-
33
-
34
-
35
-
36
-
37
-
38
-
39
-
40
-
41
-
42
-
43
-
44
-
45
-
46
-
47
-
48
-
49
-
50
-
51
-
52
-
53
-
54
-
55
-
56
-
57
-
58
-
59
-
60
-
61
-
62
-
63
-
64
-
65
-
66
-
67
-
68
-
69
-
70
-
71
-
72
-
73
-
74
-
75
-
76
-
77
-
78
-
79
-
80
-
81
-
82
-
83
-
84
-
85
-
86
-
87
-
88
-
89
-
90
-
91
-
92
-
93
-
94
-
95
-
96
-
97
-
 98
98 -
 99
99 -
 100
100 -
 101
101 -
 102
102 -
 103
103 -
 104
104 -
 105
105 -
 106
106 -
 107
107 -
 108
108 -
 109
109 -
 110
110 -
 111
111 -
 112
112 -
 113
113 -
 114
114 -
 115
115 -
 116
116 -
 117
117 -
 118
118 -
119
-
120
-
121
-
122
-
123
-
124
-
125
-
126
-
127
-
128
-
129
-
130
-
131
-
132
-
133
-
134
-
135
 |
 |

THE DIRECTV GROUP, INC.
NOTES TO THE CONSOLIDATED FINANCIAL STATEMENTS—(continued)
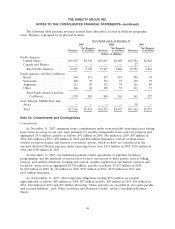
The following table presents revenues earned from subscribers located in different geographic
areas. Property is grouped by its physical location.
Years Ended and As of December 31,
2007 2006 2005
Net Property Net Property Net Property
Revenues & Satellites Revenues & Satellites Revenues & Satellites
(Dollars in Millions)
North America
United States ............. $15,687 $5,330 $13,907 $4,088 $12,524 $2,818
Canada and Mexico ......... — — — — 27 —
Total North America ...... 15,687 5,330 13,907 4,088 12,551 2,818
South America and the Caribbean
Brazil ................... 944 251 417 159 206 69
Venezuela ................ 258 99 171 73 130 75
Argentina ................ 211 85 152 78 116 80
Other ................... 146 68 108 55 111 33
Total South America and the
Caribbean ............ 1,559 503 848 365 563 257
Asia, Europe, Middle East and
Africa ................... — — — — 50 —
Total .................... $17,246 $5,833 $14,755 $4,453 $13,164 $3,075
Note 18: Commitments and Contingencies
Commitments
At December 31, 2007, minimum future commitments under noncancelable operating leases having
lease terms in excess of one year were primarily for satellite transponder leases and real property and
aggregated $531 million, payable as follows: $97 million in 2008, $86 million in 2009, $85 million in
2010, $87 million in 2011, $90 million in 2012 and $86 million thereafter. Certain of these leases
contain escalation clauses and renewal or purchase options, which we have not considered in the
amounts disclosed. Rental expenses under operating leases were $114 million in 2007, $110 million in
2006 and $109 million in 2005.
At December 31, 2007, our minimum payments under agreements to purchase broadcast
programming, and the purchase of services that we have outsourced to third parties, such as billing
services, and satellite telemetry, tracking and control, satellite construction and launch contracts and
broadcast center services aggregated $4,740 million, payable as follows: $1,257 million in 2008,
$1,250 million in 2009, $1,142 million in 2010, $727 million in 2011, $199 million in 2012 and
$165 million thereafter.
As of December 31, 2007, other long-term obligations totaling $372 million are payable
approximately as follows: $80 million in 2008, $87 million in 2009, $90 million in 2010, $54 million in
2011, $10 million in 2012 and $51 million thereafter. These amounts are recorded in ‘‘Accounts payable
and accrued liabilities’’ and ‘‘Other Liabilities and Deferred Credits’’ in the Consolidated Balance
Sheets.
99