DIRECTV 2007 Annual Report Download - page 54
Download and view the complete annual report
Please find page 54 of the 2007 DIRECTV annual report below. You can navigate through the pages in the report by either clicking on the pages listed below, or by using the keyword search tool below to find specific information within the annual report.-
 1
1 -
2
-
3
-
4
-
5
-
6
-
7
-
8
-
9
-
10
-
11
-
12
-
13
-
14
-
15
-
16
-
17
-
18
-
19
-
20
-
21
-
22
-
23
-
24
-
25
-
26
-
27
-
28
-
29
-
30
-
31
-
32
-
33
-
34
-
35
-
36
-
37
-
38
-
39
-
40
-
41
-
42
-
43
-
 44
44 -
 45
45 -
 46
46 -
 47
47 -
 48
48 -
 49
49 -
 50
50 -
 51
51 -
 52
52 -
 53
53 -
 54
54 -
 55
55 -
 56
56 -
 57
57 -
 58
58 -
 59
59 -
 60
60 -
 61
61 -
 62
62 -
 63
63 -
 64
64 -
65
-
66
-
67
-
68
-
69
-
70
-
71
-
72
-
73
-
74
-
75
-
76
-
77
-
78
-
79
-
80
-
81
-
82
-
83
-
84
-
85
-
86
-
87
-
88
-
89
-
90
-
91
-
92
-
93
-
94
-
95
-
96
-
97
-
98
-
99
-
100
-
101
-
102
-
103
-
104
-
105
-
106
-
107
-
108
-
109
-
110
-
111
-
112
-
113
-
114
-
115
-
116
-
117
-
118
-
119
-
120
-
121
-
122
-
123
-
124
-
125
-
126
-
127
-
128
-
129
-
130
-
131
-
132
-
133
-
134
-
135
 |
 |

THE DIRECTV GROUP, INC.
RESULTS OF OPERATIONS
Year Ended December 31, 2007 Compared with the Year Ended December 31, 2006
Consolidated Results of Operations
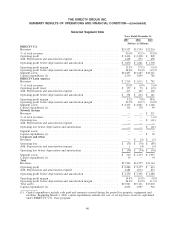
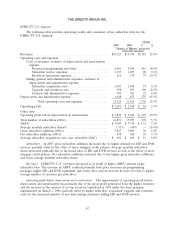
Revenues. The following table presents our revenues by segment:
Change
Revenues by segment: 2007 2006 $ %
(Dollars in Millions)
DIRECTV U.S. .................................... $15,527 $13,744 $1,783 13.0%
DIRECTV Latin America ............................. 1,719 1,013 706 69.7%
Corporate and Other ................................. — (2) 2 (100.0)%
Total Revenues .................................. $17,246 $14,755 $2,491 16.9%
The increase in our total revenues was due to higher ARPU and subscriber growth at DIRECTV
U.S. and DIRECTV Latin America, as well as the acquisition of Sky Brazil in August 2006. We discuss
these changes for each of our segments in more detail below.
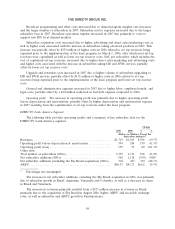
Operating profit before depreciation and amortization. The following table presents our operating
profit (loss) before depreciation and amortization by segment:
Change
Operating profit (loss) before depreciation and amortization by segment: 2007 2006 $ %
(Dollars in Millions)
DIRECTV U.S. ........................................ $3,850 $3,221 $629 19.5%
DIRECTV Latin America ................................. 394 244 150 61.5%
Corporate and Other ..................................... (74) (74) — —
Total operating profit before depreciation and amortization ......... $4,170 $3,391 $779 23.0%
The increase in total operating profit before depreciation and amortization was due to higher gross
profit from the increase in revenues, the implementation of the DIRECTV U.S. lease program in
March 2006 and the acquisition of Sky Brazil in August 2006, partially offset by higher subscriber
acquisition and upgrade and retention costs at DIRECTV U.S. due to an increased number of new and
existing subscribers adding HD and DVR services and gains totaling $118 million for the completion of
the Sky Mexico and Sky Brazil transactions in 2006. We discuss these changes for each of our segments
in more detail below.
Operating profit. The following table presents our operating profit (loss) by segment:
Change
Operating profit (loss) by segment: 2007 2006 $ %
(Dollars in Millions)
DIRECTV U.S. ....................................... $2,402 $2,348 $ 54 2.3%
DIRECTV Latin America ................................ 159 79 80 101.3%
Corporate and Other .................................... (75) (70) (5) 7.1%
Total operating profit .................................... $2,486 $2,357 $129 5.5%
The increase in our operating profit was primarily due to the increase in operating profits before
depreciation and amortization, partially offset by higher depreciation and amortization expense due to
45