DIRECTV 2007 Annual Report Download - page 47
Download and view the complete annual report
Please find page 47 of the 2007 DIRECTV annual report below. You can navigate through the pages in the report by either clicking on the pages listed below, or by using the keyword search tool below to find specific information within the annual report.-
 1
1 -
2
-
3
-
4
-
5
-
6
-
7
-
8
-
9
-
10
-
11
-
12
-
13
-
14
-
15
-
16
-
17
-
18
-
19
-
20
-
21
-
22
-
23
-
24
-
25
-
26
-
27
-
28
-
29
-
30
-
31
-
32
-
33
-
34
-
35
-
36
-
 37
37 -
 38
38 -
 39
39 -
 40
40 -
 41
41 -
 42
42 -
 43
43 -
 44
44 -
 45
45 -
 46
46 -
 47
47 -
 48
48 -
 49
49 -
 50
50 -
 51
51 -
 52
52 -
 53
53 -
 54
54 -
 55
55 -
 56
56 -
 57
57 -
58
-
59
-
60
-
61
-
62
-
63
-
64
-
65
-
66
-
67
-
68
-
69
-
70
-
71
-
72
-
73
-
74
-
75
-
76
-
77
-
78
-
79
-
80
-
81
-
82
-
83
-
84
-
85
-
86
-
87
-
88
-
89
-
90
-
91
-
92
-
93
-
94
-
95
-
96
-
97
-
98
-
99
-
100
-
101
-
102
-
103
-
104
-
105
-
106
-
107
-
108
-
109
-
110
-
111
-
112
-
113
-
114
-
115
-
116
-
117
-
118
-
119
-
120
-
121
-
122
-
123
-
124
-
125
-
126
-
127
-
128
-
129
-
130
-
131
-
132
-
133
-
134
-
135
 |
 |

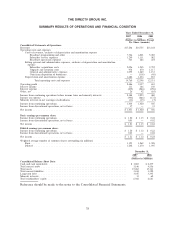
THE DIRECTV GROUP, INC.
SUMMARY RESULTS OF OPERATIONS AND FINANCIAL CONDITION
Years Ended December 31,
2007 2006 2005
(Dollars in Millions, Except
Per Share Amounts)
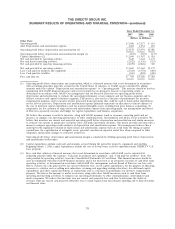
Consolidated Statements of Operations:
Revenues ........................................................ $17,246 $14,755 $13,164
Operating costs and expenses
Costs of revenues, exclusive of depreciation and amortization expense
Broadcast programming and other .................................. 7,346 6,201 5,485
Subscriber service expenses ....................................... 1,240 1,111 982
Broadcast operations expenses ..................................... 323 286 254
Selling, general and administrative expenses, exclusive of depreciation and amortization
expense
Subscriber acquisitions costs ...................................... 2,096 1,945 2,752
Upgrade and retention costs ...................................... 976 870 1,117
General and administrative expenses ................................. 1,095 1,069 1,133
Gain from disposition of businesses .................................. — (118) (45)
Depreciation and amortization expense .................................. 1,684 1,034 853
Total operating costs and expenses ............................... 14,760 12,398 12,531
Operating profit .................................................... 2,486 2,357 633
Interest income .................................................... 111 146 150
Interest expense .................................................... (235) (246) (238)
Other, net ....................................................... 26 42 (65)
Income from continuing operations before income taxes and minority interests ............ 2,388 2,299 480
Income tax expense .................................................. (943) (866) (172)
Minority interests in net earnings of subsidiaries ............................... (11) (13) (3)
Income from continuing operations ........................................ 1,434 1,420 305
Income from discontinued operations, net of taxes .............................. 17 — 31
Net income ....................................................... $1,451 $ 1,420 $ 336
Basic earnings per common share:
Income from continuing operations ........................................ $ 1.20 $ 1.13 $ 0.22
Income from discontinued operations, net of taxes .............................. 0.01 — 0.02
Net income ....................................................... $ 1.21 $ 1.13 $ 0.24
Diluted earnings per common share:
Income from continuing operations ........................................ $ 1.20 $ 1.12 $ 0.22
Income from discontinued operations, net of taxes .............................. 0.01 — 0.02
Net income ....................................................... $ 1.21 $ 1.12 $ 0.24
Weighted average number of common shares outstanding (in millions)
Basic ........................................................ 1,195 1,262 1,388
Diluted ...................................................... 1,202 1,270 1,395
December 31,
2007 2006
(Dollars in Millions)
Consolidated Balance Sheet Data:
Cash and cash equivalents ................................................ $1,083 $ 2,499
Total current assets ..................................................... 3,146 4,556
Total assets .......................................................... 15,063 15,141
Total current liabilities ................................................... 3,434 3,322
Long-term debt ....................................................... 3,347 3,395
Minority interests ...................................................... 11 62
Total stockholders’ equity ................................................. 6,302 6,681
Reference should be made to the notes to the Consolidated Financial Statements.
38