DIRECTV 2005 Annual Report Download - page 79
Download and view the complete annual report
Please find page 79 of the 2005 DIRECTV annual report below. You can navigate through the pages in the report by either clicking on the pages listed below, or by using the keyword search tool below to find specific information within the annual report.-
 1
1 -
2
-
3
-
4
-
5
-
6
-
7
-
8
-
9
-
10
-
11
-
12
-
13
-
14
-
15
-
16
-
17
-
18
-
19
-
20
-
21
-
22
-
23
-
24
-
25
-
26
-
27
-
28
-
29
-
30
-
31
-
32
-
33
-
34
-
35
-
36
-
37
-
38
-
39
-
40
-
41
-
42
-
43
-
44
-
45
-
46
-
47
-
48
-
49
-
50
-
51
-
52
-
53
-
54
-
55
-
56
-
57
-
58
-
59
-
60
-
61
-
62
-
63
-
64
-
65
-
66
-
67
-
68
-
 69
69 -
 70
70 -
 71
71 -
 72
72 -
 73
73 -
 74
74 -
 75
75 -
 76
76 -
 77
77 -
 78
78 -
 79
79 -
 80
80 -
 81
81 -
 82
82 -
 83
83 -
 84
84 -
 85
85 -
 86
86 -
 87
87 -
 88
88 -
 89
89 -
90
-
91
-
92
-
93
-
94
-
95
-
96
-
97
-
98
-
99
-
100
-
101
-
102
-
103
-
104
-
105
-
106
-
107
-
108
-
109
-
110
-
111
-
112
-
113
-
114
-
115
-
116
-
117
-
118
-
119
-
120
-
121
-
122
-
123
-
124
-
125
-
126
-
127
-
128
-
129
-
130
-
131
-
132
-
133
-
134
-
135
-
136
-
137
-
138
-
139
-
140
-
141
-
142
-
143
-
144
-
145
-
146
 |
 |

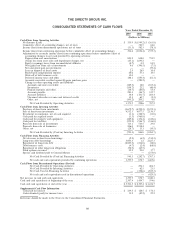
THE DIRECTV GROUP, INC.
CONSOLIDATED STATEMENTS OF CASH FLOWS
Years Ended December 31,
2005 2004 2003
(Dollars in Millions)
Cash Flows from Operating Activities
Net Income (Loss) ................................................. $ 335.9 $(1,949.2) $ (361.8)
Cumulative effect of accounting changes, net of taxes ........................... — 310.5 64.6
Income (loss) from discontinued operations, net of taxes ......................... (31.3) 582.3 (78.1)
Income (loss) from continuing operations before cumulative effect of accounting changes .... 304.6 (1,056.4) (375.3)
Adjustments to reconcile income (loss) from continuing operations before cumulative effect of
accounting changes to net cash provided by operating activities:
Depreciation and amortization ........................................ 853.2 838.0 754.9
(Gain) loss from asset sales and impairment charges, net ....................... (45.1) 1,693.2 —
Equity (earnings) losses from unconsolidated affiliates ......................... (0.7) 0.2 81.5
Net (gain) loss from sale of investments .................................. 0.6 (396.5) (7.5)
Net unrealized gain on investments ..................................... — — (79.4)
Loss on disposal of fixed assets ........................................ 2.5 24.9 10.4
Stock-based compensation expense ..................................... 40.6 57.1 10.5
Write-off of debt issuance costs ........................................ 19.0 — —
Deferred income taxes and other ....................................... 188.1 (850.4) (61.1)
Accounts receivable credited against Pegasus purchase price ..................... — (220.2) —
Change in other operating assets and liabilities
Accounts and notes receivable ....................................... (129.5) 18.8 (103.4)
Inventories ................................................... (158.7) 23.2 (40.4)
Prepaid expenses and other ......................................... (34.7) (20.8) 55.4
Accounts payable ............................................... 281.3 (46.7) 339.7
Accrued liabilities ............................................... 30.8 (101.7) 203.4
Unearned subscriber revenue and deferred credits .......................... 15.1 60.7 (2.3)
Other, net .................................................... (195.2) 205.2 0.8
Net Cash Provided by Operating Activities .............................. 1,171.9 228.6 787.2
Cash Flows from Investing Activities
Purchase of short-term investments ....................................... (4,672.7) (4,255.3) (2,475.1)
Sale of short-term investments .......................................... 4,512.1 4,077.5 2,130.3
Investment in companies, net of cash acquired ................................ (1.1) (388.5) (11.8)
Cash paid for acquired assets .......................................... (3.3) (965.8) —
Cash paid for property and equipment ..................................... (489.2) (476.4) (410.6)
Cash paid for satellites .............................................. (399.5) (546.7) (336.8)
Proceeds from sale of investments ....................................... 113.1 510.5 29.8
Proceeds from sale of businesses ........................................ 246.0 2,918.4 —
Other, net ...................................................... (28.7) 13.1 (10.5)
Net Cash Provided by (Used in) Investing Activities ........................ (723.3) 886.8 (1,084.7)
Cash Flows from Financing Activities
Net decrease in short-term borrowings ..................................... (2.5) (6.2) (515.3)
Long-term debt borrowings ............................................ 3,003.3 1.2 2,627.3
Repayment of long-term debt .......................................... (2,005.5) (214.8) (18.8)
Debt issuance costs ................................................. (4.7) (2.4) (68.8)
Repayment of other long-term obligations .................................. (90.5) (43.5) —
Stock options exercised .............................................. 45.2 23.0 17.7
Special cash dividend paid to General Motors ................................ — — (275.0)
Net Cash Provided by (Used in) Financing Activities ....................... 945.3 (242.7) 1,767.1
Net cash and cash equivalents provided by continuing operations ............... 1,393.9 872.7 1,469.6
Cash Flows from Discontinued Operations (Revised)
Net Cash Provided by Operating Activities .............................. — 276.1 404.3
Net Cash Provided by Investing Activities .............................. — 62.5 21.5
Net Cash Used in Financing Activities ................................ — (338.6) (855.3)
Net cash and cash equivalents used in discontinued operations ................. — — (429.5)
Net increase in cash and cash equivalents .................................... 1,393.9 872.7 1,040.1
Cash and cash equivalents at beginning of the year .............................. 2,307.4 1,434.7 394.6
Cash and cash equivalents at end of the year .................................. $3,701.3 $ 2,307.4 $ 1,434.7
Supplemental Cash Flow Information
Cash paid for interest ............................................... $ 239.5 $ 128.5 $ 174.1
Cash refunded (paid) for income taxes .................................... 13.2 (49.2) 29.2
Reference should be made to the Notes to the Consolidated Financial Statements.
66