DIRECTV 2005 Annual Report Download - page 111
Download and view the complete annual report
Please find page 111 of the 2005 DIRECTV annual report below. You can navigate through the pages in the report by either clicking on the pages listed below, or by using the keyword search tool below to find specific information within the annual report.-
 1
1 -
2
-
3
-
4
-
5
-
6
-
7
-
8
-
9
-
10
-
11
-
12
-
13
-
14
-
15
-
16
-
17
-
18
-
19
-
20
-
21
-
22
-
23
-
24
-
25
-
26
-
27
-
28
-
29
-
30
-
31
-
32
-
33
-
34
-
35
-
36
-
37
-
38
-
39
-
40
-
41
-
42
-
43
-
44
-
45
-
46
-
47
-
48
-
49
-
50
-
51
-
52
-
53
-
54
-
55
-
56
-
57
-
58
-
59
-
60
-
61
-
62
-
63
-
64
-
65
-
66
-
67
-
68
-
69
-
70
-
71
-
72
-
73
-
74
-
75
-
76
-
77
-
78
-
79
-
80
-
81
-
82
-
83
-
84
-
85
-
86
-
87
-
88
-
89
-
90
-
91
-
92
-
93
-
94
-
95
-
96
-
97
-
98
-
99
-
100
-
 101
101 -
 102
102 -
 103
103 -
 104
104 -
 105
105 -
 106
106 -
 107
107 -
 108
108 -
 109
109 -
 110
110 -
 111
111 -
 112
112 -
 113
113 -
 114
114 -
 115
115 -
 116
116 -
 117
117 -
 118
118 -
 119
119 -
 120
120 -
 121
121 -
122
-
123
-
124
-
125
-
126
-
127
-
128
-
129
-
130
-
131
-
132
-
133
-
134
-
135
-
136
-
137
-
138
-
139
-
140
-
141
-
142
-
143
-
144
-
145
-
146
 |
 |

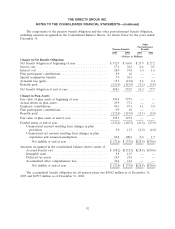
THE DIRECTV GROUP, INC.
NOTES TO THE CONSOLIDATED FINANCIAL STATEMENTS —(continued)
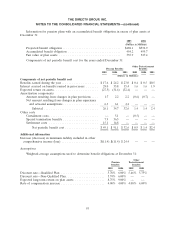
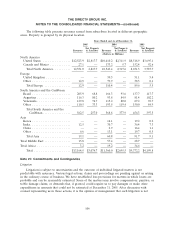
Note 13: Earnings (Loss) Per Common Share
We compute Basic Earnings (Loss) Per Common Share, or EPS, by dividing net income (loss) by
the weighted average number of common shares outstanding for the period.
Diluted EPS considers the effect of common equivalent shares, which we exclude from the
computation in loss periods as their effect would be antidilutive. We also exclude common stock
options from the computation of diluted EPS when the exercise price is greater than the average
market price of our common stock. Our existing common equivalent shares consist entirely of common
stock options and restricted stock units issued to employees. We excluded 66.1 million shares of
common stock for the year ended December 31, 2005 because the options’ exercise price was greater
than the average market price of our common stock. We excluded 88.9 million shares of common stock
and 7.8 million restricted stock units for the year ended December 31, 2004 from the calculation of
diluted EPS because they were antidilutive. For the year ended December 31, 2003, we excluded
91.2 million shares of common stock and 3.6 million restricted stock units from the calculation of
diluted EPS because they were antidilutive. We also excluded shares issuable upon conversion of our
Preferred Stock prior to the date of actual conversion because they were antidilutive.
For purposes of calculating EPS, we calculate the weighted average number of common shares
outstanding using the number of our common shares outstanding beginning on December 23, 2003 and
the number of shares in the GM Class H Dividend Base prior to December 23, 2003. The GM Class H
Dividend Base is equal to the number of shares of GM Class H common stock which, if issued and
outstanding, would have represented 100% of the tracking stock interest in our earnings prior to
December 23, 2003.
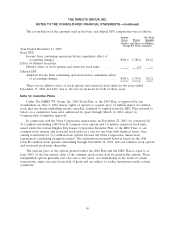
The following table sets forth comparative information regarding common shares outstanding
based on the number of our common shares outstanding beginning on December 23, 2003 and the
number of shares in the GM Class H Dividend Base prior to December 23, 2003:
2005 2004 2003
(Shares in Millions)
Common shares outstanding at January 1 ......................... 1,385.8 1,383.6 1,381.9
Increase for stock options exercised and restricted stock units issued ..... 5.2 2.2 1.7
Common shares outstanding at December 31 ...................... 1,391.0 1,385.8 1,383.6
Weighted average number of common shares outstanding ............. 1,388.4 1,384.8 1,382.5
98