DIRECTV 2005 Annual Report Download - page 119
Download and view the complete annual report
Please find page 119 of the 2005 DIRECTV annual report below. You can navigate through the pages in the report by either clicking on the pages listed below, or by using the keyword search tool below to find specific information within the annual report.-
 1
1 -
2
-
3
-
4
-
5
-
6
-
7
-
8
-
9
-
10
-
11
-
12
-
13
-
14
-
15
-
16
-
17
-
18
-
19
-
20
-
21
-
22
-
23
-
24
-
25
-
26
-
27
-
28
-
29
-
30
-
31
-
32
-
33
-
34
-
35
-
36
-
37
-
38
-
39
-
40
-
41
-
42
-
43
-
44
-
45
-
46
-
47
-
48
-
49
-
50
-
51
-
52
-
53
-
54
-
55
-
56
-
57
-
58
-
59
-
60
-
61
-
62
-
63
-
64
-
65
-
66
-
67
-
68
-
69
-
70
-
71
-
72
-
73
-
74
-
75
-
76
-
77
-
78
-
79
-
80
-
81
-
82
-
83
-
84
-
85
-
86
-
87
-
88
-
89
-
90
-
91
-
92
-
93
-
94
-
95
-
96
-
97
-
98
-
99
-
100
-
101
-
102
-
103
-
104
-
105
-
106
-
107
-
108
-
 109
109 -
 110
110 -
 111
111 -
 112
112 -
 113
113 -
 114
114 -
 115
115 -
 116
116 -
 117
117 -
 118
118 -
 119
119 -
 120
120 -
 121
121 -
 122
122 -
 123
123 -
 124
124 -
 125
125 -
 126
126 -
 127
127 -
 128
128 -
 129
129 -
130
-
131
-
132
-
133
-
134
-
135
-
136
-
137
-
138
-
139
-
140
-
141
-
142
-
143
-
144
-
145
-
146
 |
 |

THE DIRECTV GROUP, INC.
NOTES TO THE CONSOLIDATED FINANCIAL STATEMENTS —(continued)
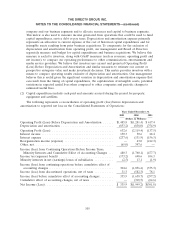
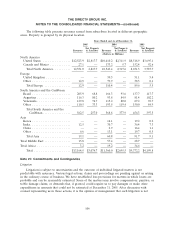
The following table presents revenues earned from subscribers located in different geographic
areas. Property is grouped by its physical location.
Years Ended and As of December 31,
2005 2004 2003
Net Property Net Property Net Property
Revenues & Satellites Revenues & Satellites Revenues & Satellites
(Dollars in Millions)
North America
United States ................ $12,523.9 $2,817.7 $10,410.2 $2,311.9 $8,518.9 $3,695.1
Canada and Mexico ............ 27.1 — 133.2 5.7 152.4 92.6
Total North America .......... 12,551.0 2,817.7 10,543.4 2,317.6 8,671.3 3,787.7
Europe
United Kingdom .............. — — 30.5 — 51.1 5.4
Other ...................... 12.9 — 79.9 — 38.5 0.1
Total Europe ............... 12.9 — 110.4 — 89.6 5.5
South America and the Caribbean
Brazil ...................... 205.9 68.8 166.3 93.6 137.7 117.7
Argentina ................... 116.3 80.2 93.8 84.9 81.4 102.2
Venezuela ................... 129.8 74.7 115.2 80.0 87.2 92.7
Other ...................... 110.5 33.3 193.5 119.4 150.0 84.9
Total South America and the
Caribbean ................ 562.5 257.0 568.8 377.9 456.3 397.5
Asia
Korea ...................... — — 14.1 — 19.2 0.2
India ....................... 12.5 — 30.7 — 36.4 7.3
China ...................... — — 2.9 — 16.4 1.1
Other ...................... 6.6 — 13.1 — 19.7 0.5
Total Asia ................. 19.1 — 60.8 — 91.7 9.1
Total Middle East ............... 15.8 — 57.4 — 28.7 —
Total Africa ................... 3.2 — 19.2 — 34.6 —
Total ..................... $13,164.5 $3,074.7 $11,360.0 $2,695.5 $9,372.2 $4,199.8
Note 21: Commitments and Contingencies
Litigation
Litigation is subject to uncertainties and the outcome of individual litigated matters is not
predictable with assurance. Various legal actions, claims and proceedings are pending against us arising
in the ordinary course of business. We have established loss provisions for matters in which losses are
probable and can be reasonably estimated. Some of the matters may involve compensatory, punitive, or
treble damage claims, or demands that, if granted, could require us to pay damages or make other
expenditures in amounts that could not be estimated at December 31, 2005. After discussion with
counsel representing us in those actions, it is the opinion of management that such litigation is not
106