DIRECTV 2005 Annual Report Download - page 113
Download and view the complete annual report
Please find page 113 of the 2005 DIRECTV annual report below. You can navigate through the pages in the report by either clicking on the pages listed below, or by using the keyword search tool below to find specific information within the annual report.-
 1
1 -
2
-
3
-
4
-
5
-
6
-
7
-
8
-
9
-
10
-
11
-
12
-
13
-
14
-
15
-
16
-
17
-
18
-
19
-
20
-
21
-
22
-
23
-
24
-
25
-
26
-
27
-
28
-
29
-
30
-
31
-
32
-
33
-
34
-
35
-
36
-
37
-
38
-
39
-
40
-
41
-
42
-
43
-
44
-
45
-
46
-
47
-
48
-
49
-
50
-
51
-
52
-
53
-
54
-
55
-
56
-
57
-
58
-
59
-
60
-
61
-
62
-
63
-
64
-
65
-
66
-
67
-
68
-
69
-
70
-
71
-
72
-
73
-
74
-
75
-
76
-
77
-
78
-
79
-
80
-
81
-
82
-
83
-
84
-
85
-
86
-
87
-
88
-
89
-
90
-
91
-
92
-
93
-
94
-
95
-
96
-
97
-
98
-
99
-
100
-
101
-
102
-
 103
103 -
 104
104 -
 105
105 -
 106
106 -
 107
107 -
 108
108 -
 109
109 -
 110
110 -
 111
111 -
 112
112 -
 113
113 -
 114
114 -
 115
115 -
 116
116 -
 117
117 -
 118
118 -
 119
119 -
 120
120 -
 121
121 -
 122
122 -
 123
123 -
124
-
125
-
126
-
127
-
128
-
129
-
130
-
131
-
132
-
133
-
134
-
135
-
136
-
137
-
138
-
139
-
140
-
141
-
142
-
143
-
144
-
145
-
146
 |
 |

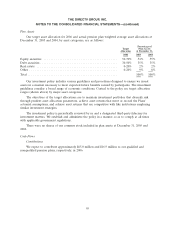
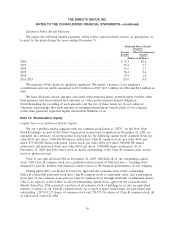
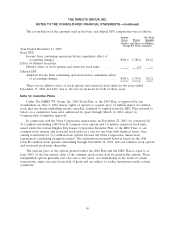
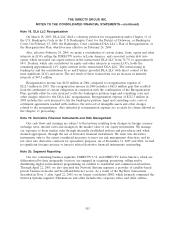
THE DIRECTV GROUP, INC.
NOTES TO THE CONSOLIDATED FINANCIAL STATEMENTS —(continued)
Changes in the status of outstanding options were as follows:
Shares Under Weighted-Average
Option Exercise Price
Outstanding at January 1, 2003 ............................... 95,080,832 $23.16
Granted ............................................... 25,000 16.35
Exercised ............................................... (1,780,076) 10.15
Terminated ............................................. (2,164,436) 28.73
Outstanding at December 31, 2003 ............................ 91,161,320 23.28
Granted ............................................... 1,883,764 18.80
Exercised ............................................... (2,139,782) 10.72
Terminated ............................................. (1,971,186) 26.45
Outstanding at December 31, 2004 ............................ 88,934,116 23.42
Granted ............................................... — —
Exercised ............................................... (4,170,758) 10.83
Terminated ............................................. (6,048,852) 17.80
Outstanding at December 31, 2005 ............................ 78,714,506 24.52
The following table summarizes information about stock options outstanding at December 31,
2005:
Options Outstanding Options Exercisable
Weighted-
Average Weighted- Weighted-
Remaining Average Average
Range of Number Contractual Exercise Number Exercise
Exercise Prices Outstanding Life (years) Price Exercisable Price
$9.00 to $16.99 20,090,642 2.4 $ 12.71 20,090,642 $12.71
17.00 to 24.99 20,322,637 5.0 19.80 20,322,637 19.80
25.00 to 32.99 16,080,804 5.0 27.77 16,080,804 27.77
33.00 to 41.99 22,220,423 4.3 37.16 22,220,423 37.16
78,714,506 2.9 24.52 78,714,506 24.52
Of the options outstanding at December 31, 2004 there were 88.9 million options exercisable at a
weighted average exercise price of $23.42, and of the options outstanding at December 31, 2003, there
were 87.6 million options exercisable at a weighted average price of $23.40.
The following table presents the estimated weighted average fair value for stock options granted
under the Plan using the Black-Scholes valuation model along with the assumptions used in the fair
value calculations:
2004 2003
Estimated fair value per option granted ........................... $ 5.82 $ 8.80
Average exercise price per option granted ......................... 18.80 16.35
Expected stock volatility ...................................... 30.0% 47.2%
Risk-free interest rate ........................................ 3.7% 3.8%
Expected option life (in years) .................................. 5.6 7.0
100