DIRECTV 2005 Annual Report Download - page 58
Download and view the complete annual report
Please find page 58 of the 2005 DIRECTV annual report below. You can navigate through the pages in the report by either clicking on the pages listed below, or by using the keyword search tool below to find specific information within the annual report.
THE DIRECTV GROUP, INC.
Cumulative Effect of Accounting Change. The $310.5 million cumulative effect of accounting
change, net of taxes, in 2004 was due to our change in our method of accounting for subscriber
acquisition, upgrade and retention costs.
DIRECTV U.S. Segment
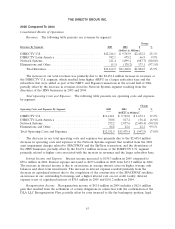
The following table provides operating results and a summary of key subscriber data for the
DIRECTV U.S. segment:
Change
2005 2004 $ %
(Dollars in Millions, Except Per Subscriber
Amounts)
Revenues ....................................... $12,216.1 $9,763.9 $2,452.2 25.1%
Operating Costs and Expenses, exclusive of depreciation and
amortization expense shown separately below:
Broadcast programming and other costs of sale ........ 5,050.1 4,010.5 1,039.6 25.9%
Subscriber service expenses ....................... 935.4 740.2 195.2 26.4%
Subscriber acquisition costs:
Third party customer acquisitions ............... 1,999.4 1,960.8 38.6 2.0%
Direct customer acquisitions ................... 676.4 684.1 (7.7) (1.1)%
Upgrade and retention costs ...................... 1,106.5 993.2 113.3 11.4%
Broadcast operations expenses .................... 145.8 129.7 16.1 12.4%
General and administrative expenses ................ 802.3 662.3 140.0 21.1%
Depreciation and amortization expense ................. 698.2 561.2 137.0 24.4%
Total Operating Costs and Expenses .......... 11,414.1 9,742.0 1,672.1 17.2%
Operating Profit .................................. $ 802.0 $ 21.9 $ 780.1 NM*
Other Data:
Operating Profit Before Depreciation & Amortization ...... $ 1,500.2 $ 583.1 $ 917.1 NM
Total number of subscribers (000’s) .................... 15,133 13,940 1,193 8.6%
ARPU ......................................... $ 69.61 $ 66.95 $ 2.66 4.0%
Average monthly subscriber churn% ................... 1.70% 1.59% — 6.9%
Gross subscriber additions (000’s)(1) ................... 4,170 4,218 (48) (1.1)%
Net subscriber additions (000’s) ....................... 1,193 1,728 (535) (31.0)%
Average subscriber acquisition costs — per subscriber
(SAC)(2) ...................................... $ 642 $ 643 $ (1) (0.2)%
* Percentage not meaningful
(1) Gross subscriber additions for 2004 excludes the 1.4 million subscribers purchased as part of the
NRTC and Pegasus transactions.
(2) Gross subscriber additions used in the calculation of SAC also do not include subscribers added in
the former NRTC and Pegasus territories prior to the NRTC and Pegasus transactions in 2004.
Subscribers. DIRECTV U.S.’ gross subscriber additions in 2005 of 4,170,000 were slightly lower
than the 4,218,000 of gross subscriber additions in 2004 primarily due to more stringent credit policies
implemented during the second quarter of 2005. Average monthly churn during 2005 increased to
1.70% due to higher involuntary churn from higher risk subscribers acquired in 2004 and early 2005
45


