DIRECTV 2005 Annual Report Download - page 61
Download and view the complete annual report
Please find page 61 of the 2005 DIRECTV annual report below. You can navigate through the pages in the report by either clicking on the pages listed below, or by using the keyword search tool below to find specific information within the annual report.-
 1
1 -
2
-
3
-
4
-
5
-
6
-
7
-
8
-
9
-
10
-
11
-
12
-
13
-
14
-
15
-
16
-
17
-
18
-
19
-
20
-
21
-
22
-
23
-
24
-
25
-
26
-
27
-
28
-
29
-
30
-
31
-
32
-
33
-
34
-
35
-
36
-
37
-
38
-
39
-
40
-
41
-
42
-
43
-
44
-
45
-
46
-
47
-
48
-
49
-
50
-
 51
51 -
 52
52 -
 53
53 -
 54
54 -
 55
55 -
 56
56 -
 57
57 -
 58
58 -
 59
59 -
 60
60 -
 61
61 -
 62
62 -
 63
63 -
 64
64 -
 65
65 -
 66
66 -
 67
67 -
 68
68 -
 69
69 -
 70
70 -
 71
71 -
72
-
73
-
74
-
75
-
76
-
77
-
78
-
79
-
80
-
81
-
82
-
83
-
84
-
85
-
86
-
87
-
88
-
89
-
90
-
91
-
92
-
93
-
94
-
95
-
96
-
97
-
98
-
99
-
100
-
101
-
102
-
103
-
104
-
105
-
106
-
107
-
108
-
109
-
110
-
111
-
112
-
113
-
114
-
115
-
116
-
117
-
118
-
119
-
120
-
121
-
122
-
123
-
124
-
125
-
126
-
127
-
128
-
129
-
130
-
131
-
132
-
133
-
134
-
135
-
136
-
137
-
138
-
139
-
140
-
141
-
142
-
143
-
144
-
145
-
146
 |
 |

THE DIRECTV GROUP, INC.
The decrease in revenues, operating loss before depreciation and amortization and operating loss
resulted primarily from the divestitures of the HNS businesses. Operating loss before depreciation and
amortization and operating loss in 2004 include asset impairment charges of $1,466.1 million related to
SPACEWAY and $190.6 million for the SkyTerra transactions, as well as $25.6 million in severance
charges associated with the HNS related transactions discussed above in ‘‘Strategic Developments.’’
Eliminations and Other
The elimination of revenues decreased to $5.1 million in 2005 from $178.2 million in 2004. The
revenue elimination resulted mostly from the elimination of sales from HNS to DIRECTV prior to the
sale of HNS’ set-top receiver manufacturing business in June 2004.
Operating loss from Eliminations and Other decreased to $89.9 million in 2005 from $220.8 million
in 2004. Operating loss in 2004 included $16.5 million in higher stock compensation costs and
non-recurring charges in the amount of $113.0 million for retention benefits, severance and related
costs under our pension benefit plans resulting from headcount reductions and the strategic
transactions discussed above.
2004 Compared To 2003
Consolidated Results of Operations
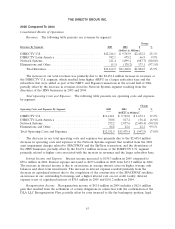
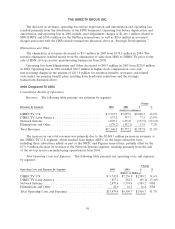
Revenues. The following table presents our revenues by segment:
Change
Revenues By Segment: 2004 2003 $ %
(Dollars in Millions)
DIRECTV U.S. .................................. $ 9,763.9 $7,695.6 $2,068.3 26.9%
DIRECTV Latin America ........................... 675.2 597.7 77.5 13.0%
Network Systems ................................. 1,099.1 1,271.0 (171.9) (13.5)%
Eliminations and Other ............................. (178.2) (192.1) 13.9 7.2%
Total Revenues ................................... $11,360.0 $9,372.2 $1,987.8 21.2%
The increase in our total revenues was primarily due to the $2,068.3 million increase in revenues at
the DIRECTV U.S. segment, which resulted from higher ARPU on the larger subscriber base,
including those subscribers added as part of the NRTC and Pegasus transactions, partially offset by the
$171.9 million decrease in revenues at the Network Systems segment, resulting primarily from the sale
of the set-top receiver manufacturing operations in June 2004.
Total Operating Costs and Expenses. The following table presents our operating costs and expenses
by segment:
Change
Operating Costs and Expenses By Segment: 2004 2003 $ %
(Dollars in Millions)
DIRECTV U.S. ................................... $ 9,742.0 $7,236.8 $2,505.2 34.6%
DIRECTV Latin America ........................... 817.2 882.3 (65.1) (7.4)%
Network Systems .................................. 2,877.6 1,374.4 1,503.2 NM
Eliminations and Other ............................. 42.6 16.2 26.4 NM
Total Operating Costs and Expenses .................... $13,479.4 $9,509.7 $3,969.7 41.7%
48