DIRECTV 2005 Annual Report Download - page 56
Download and view the complete annual report
Please find page 56 of the 2005 DIRECTV annual report below. You can navigate through the pages in the report by either clicking on the pages listed below, or by using the keyword search tool below to find specific information within the annual report.-
 1
1 -
2
-
3
-
4
-
5
-
6
-
7
-
8
-
9
-
10
-
11
-
12
-
13
-
14
-
15
-
16
-
17
-
18
-
19
-
20
-
21
-
22
-
23
-
24
-
25
-
26
-
27
-
28
-
29
-
30
-
31
-
32
-
33
-
34
-
35
-
36
-
37
-
38
-
39
-
40
-
41
-
42
-
43
-
44
-
45
-
 46
46 -
 47
47 -
 48
48 -
 49
49 -
 50
50 -
 51
51 -
 52
52 -
 53
53 -
 54
54 -
 55
55 -
 56
56 -
 57
57 -
 58
58 -
 59
59 -
 60
60 -
 61
61 -
 62
62 -
 63
63 -
 64
64 -
 65
65 -
 66
66 -
67
-
68
-
69
-
70
-
71
-
72
-
73
-
74
-
75
-
76
-
77
-
78
-
79
-
80
-
81
-
82
-
83
-
84
-
85
-
86
-
87
-
88
-
89
-
90
-
91
-
92
-
93
-
94
-
95
-
96
-
97
-
98
-
99
-
100
-
101
-
102
-
103
-
104
-
105
-
106
-
107
-
108
-
109
-
110
-
111
-
112
-
113
-
114
-
115
-
116
-
117
-
118
-
119
-
120
-
121
-
122
-
123
-
124
-
125
-
126
-
127
-
128
-
129
-
130
-
131
-
132
-
133
-
134
-
135
-
136
-
137
-
138
-
139
-
140
-
141
-
142
-
143
-
144
-
145
-
146
 |
 |

THE DIRECTV GROUP, INC.
2005 Compared To 2004
Consolidated Results of Operations
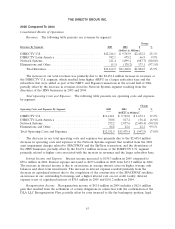
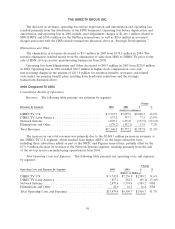
Revenues. The following table presents our revenues by segment:
Change
Revenues By Segment: 2005 2004 $ %
(Dollars in Millions)
DIRECTV U.S. ................................. $12,216.1 $ 9,763.9 $2,452.2 25.1%
DIRECTV Latin America .......................... 742.1 675.2 66.9 9.9%
Network Systems ................................. 211.4 1,099.1 (887.7) (80.8)%
Eliminations and Other ............................ (5.1) (178.2) 173.1 (97.1)%
Total Revenues ............................... $13,164.5 $11,360.0 $1,804.5 15.9%
The increase in our total revenues was primarily due to the $2,452.2 million increase in revenues at
the DIRECTV U.S. segment, which resulted from higher ARPU on a larger subscriber base and the
subscribers that were added as part of the NRTC and Pegasus transactions in the second half of 2004,
partially offset by the decrease in revenues from the Network Systems segment resulting from the
divestures of the HNS businesses in 2005 and 2004.
Total Operating Costs and Expenses. The following table presents our operating costs and expenses
by segment:
Change
Operating Costs and Expenses By Segment: 2005 2004 $ %
(Dollars in Millions)
DIRECTV U.S. ................................. $11,414.1 $ 9,742.0 $ 1,672.1 17.2%
DIRECTV Latin America ......................... 760.8 817.2 (56.4) (6.9)%
Network Systems ................................ 272.2 2,877.6 (2,605.4) (90.5)%
Eliminations and Other ........................... 84.8 42.6 42.2 99.1%
Total Operating Costs and Expenses .................. $12,531.9 $13,479.4 $ (947.5) (7.0)%
The decrease in our total operating costs and expenses was primarily due to the $2,605.4 million
decrease in operating costs and expenses at the Network Systems segment that resulted from the 2004
asset impairment charges related to SPACEWAY and the SkyTerra transaction, and the divestitures of
the HNS businesses, partially offset by the $1,672.1 million increase at the DIRECTV U.S. segment
primarily related to higher costs associated with the increase in revenues and the larger subscriber base.
Interest Income and Expense. Interest income increased to $150.3 million in 2005 compared to
$50.6 million in 2004. Interest expense increased to $237.6 million in 2005 from $131.9 million in 2004.
The increase in interest income is due to an increase in average interest rates on higher average cash
balances and short-term investments. The increase in interest expense resulted primarily from the
decrease in capitalized interest due to the completion of the construction of the SPACEWAY satellites,
an increase in our outstanding borrowings and a higher interest rate on our credit facility. Interest
expense is net of capitalized interest of $30.5 million in 2005 and $101.2 million in 2004.
Reorganization Income. Reorganization income of $43.0 million in 2004 includes a $62.6 million
gain that resulted from the settlement of certain obligations in connection with the confirmation of the
DLA LLC Reorganization Plan, partially offset by costs incurred to file the bankruptcy petition, legal
43