DIRECTV 2005 Annual Report Download - page 60
Download and view the complete annual report
Please find page 60 of the 2005 DIRECTV annual report below. You can navigate through the pages in the report by either clicking on the pages listed below, or by using the keyword search tool below to find specific information within the annual report.
THE DIRECTV GROUP, INC.
DIRECTV Latin America Segment
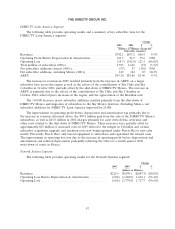
The following table provides operating results and a summary of key subscriber data for the
DIRECTV Latin America segment:
Change
2005 2004 $ %
(Dollars in Millions, Except Per
Subscriber Amounts)
Revenues ............................................. $742.1 $675.2 $66.9 9.9%
Operating Profit Before Depreciation & Amortization ............ 141.5 45.9 95.6 NM
Operating Loss ........................................ (18.7) (142.0) 123.3 (86.8)%
Total number of subscribers (000’s) .......................... 1,593 1,646 (53) (3.2)%
Net subscriber additions (losses) (000’s) ....................... (53) 57 (110) NM
Net subscriber additions, excluding Mexico (000’s) ............... 149 124 25 20.2%
ARPU ............................................... $39.20 $35.80 $3.40 9.5%
The increase in revenues in 2005 resulted primarily from the increase in ARPU on a larger
subscriber base across the region as well as the effects of the consolidation of Sky Chile and Sky
Colombia in October 2004, partially offset by the shut-down of DIRECTV Mexico. The increase in
ARPU is primarily due to the effects of the consolidation of Sky Chile and Sky Colombia in
October 2004, selected price increases in the region, and the appreciation of the Brazilian real.
The 110,000 decrease in net subscriber additions resulted primarily from the shut-down of
DIRECTV Mexico and migration of subscribers to the Sky Mexico platform. Excluding Mexico, net
subscriber additions for DIRECTV Latin America improved by 25,000.
The improvement in operating profit before depreciation and amortization was primarily due to
the increase in revenues discussed above, the $70.4 million gain from the sale of the DIRECTV Mexico
subscribers, as well as $45.0 million in 2004 charges primarily for asset write-downs, severance and
other costs related to the shut-down of DIRECTV Mexico. These increases were partially offset by
approximately $25 million of increased costs in 2005 related to the merger in Colombia and certain
subscriber acquisition, upgrade and retention costs now being expensed under Puerto Rico’s new sales
model. Previously, Puerto Rico only leased equipment to subscribers and capitalized the related costs.
The improvement in operating loss was due to the increase in operating profit before depreciation and
amortization and reduced depreciation principally reflecting the effect of a fourth quarter 2004
write-down of assets in Mexico.
Network Systems Segment
The following table provides operating results for the Network Systems segment:
Change
2005 2004 $ %
(Dollars in Millions)
Revenues .......................................... $211.4 $1,099.1 $(887.7) (80.8)%
Operating Loss Before Depreciation & Amortization .......... (60.8) (1,682.9) 1,622.1 (96.4)%
Operating Loss ...................................... (60.8) (1,778.5) 1,717.7 (96.6)%
47


