Classmates.com 2007 Annual Report Download - page 85
Download and view the complete annual report
Please find page 85 of the 2007 Classmates.com annual report below. You can navigate through the pages in the report by either clicking on the pages listed below, or by using the keyword search tool below to find specific information within the annual report.-
 1
1 -
2
-
3
-
4
-
5
-
6
-
7
-
8
-
9
-
10
-
11
-
12
-
13
-
14
-
15
-
16
-
17
-
18
-
19
-
20
-
21
-
22
-
23
-
24
-
25
-
26
-
27
-
28
-
29
-
30
-
31
-
32
-
33
-
34
-
35
-
36
-
37
-
38
-
39
-
40
-
41
-
42
-
43
-
44
-
45
-
46
-
47
-
48
-
49
-
50
-
51
-
52
-
53
-
54
-
55
-
56
-
57
-
58
-
59
-
60
-
61
-
62
-
63
-
64
-
65
-
66
-
67
-
68
-
69
-
70
-
71
-
72
-
73
-
74
-
 75
75 -
 76
76 -
 77
77 -
 78
78 -
 79
79 -
 80
80 -
 81
81 -
 82
82 -
 83
83 -
 84
84 -
 85
85 -
 86
86 -
 87
87 -
 88
88 -
 89
89 -
 90
90 -
 91
91 -
 92
92 -
 93
93 -
 94
94 -
 95
95 -
96
-
97
-
98
-
99
-
100
-
101
-
102
-
103
-
104
-
105
-
106
-
107
-
108
-
109
-
110
-
111
-
112
-
113
-
114
-
115
-
116
-
117
-
118
-
119
-
120
-
121
-
122
-
123
-
124
-
125
-
126
-
127
-
128
-
129
-
130
-
131
-
132
-
133
-
134
-
135
-
136
-
137
-
138
-
139
-
140
-
141
-
142
-
143
-
144
-
145
-
146
-
147
-
148
-
149
-
150
-
151
-
152
-
153
 |
 |
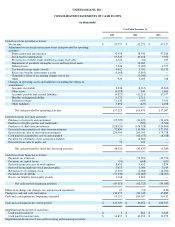
UNITED ONLINE, INC.
CONSOLIDATED STATEMENTS OF OPERATIONS
(in thousands, except per share amounts)
The accompanying notes are an integral part of these consolidated financial statements.
F-4
Year Ended December 31,
2007
2006
2005
Revenues
$
513,503
$
522,654
$
525,061
Operating expenses:
Cost of revenues (including stock
-
based compensation, see Note 5)
117,203
119,990
110,672
Sales and marketing (including stock
-
based compensation, see Note 5)
163,424
176,980
209,292
Product development (including stock
-
based compensation, see Note 5)
51,044
52,602
40,009
General and administrative (including stock
-
based compensation, see Note 5)
73,312
67,511
56,729
Amortization of intangible assets
12,800
17,640
21,799
Restructuring charges
3,419
627
—
Impairment of goodwill, intangible assets and long
-
lived assets
—
13,285
—
Total operating expenses
421,202
448,635
438,501
Operating income
92,301
74,019
86,560
Interest and other income, net
7,555
6,076
6,885
Interest expense
(1,164
)
(2,571
)
(6,073
)
Income before income taxes
98,692
77,524
87,372
Provision for income taxes
40,915
36,293
40,245
Income before cumulative effect of accounting change
57,777
41,231
47,127
Cumulative effect of accounting change, net of tax (see Note 1)
—
1,041
—
Net income
$
57,777
$
42,272
$
47,127
Basic net income per share:
Income before cumulative effect of accounting change
$
0.87
$
0.64
$
0.77
Cumulative effect of accounting change, net of tax
—
0.02
—
Basic net income per share
$
0.87
$
0.66
$
0.77
Diluted net income per share:
Income before cumulative effect of accounting change
$
0.83
$
0.62
$
0.74
Cumulative effect of accounting change, net of tax
—
0.02
—
Diluted net income per share
$
0.83
$
0.64
$
0.74
Shares used to calculate basic net income per share
66,768
64,001
61,135
Shares used to calculate diluted net income per share
69,287
66,269
63,815