Classmates.com 2007 Annual Report Download - page 65
Download and view the complete annual report
Please find page 65 of the 2007 Classmates.com annual report below. You can navigate through the pages in the report by either clicking on the pages listed below, or by using the keyword search tool below to find specific information within the annual report.-
 1
1 -
2
-
3
-
4
-
5
-
6
-
7
-
8
-
9
-
10
-
11
-
12
-
13
-
14
-
15
-
16
-
17
-
18
-
19
-
20
-
21
-
22
-
23
-
24
-
25
-
26
-
27
-
28
-
29
-
30
-
31
-
32
-
33
-
34
-
35
-
36
-
37
-
38
-
39
-
40
-
41
-
42
-
43
-
44
-
45
-
46
-
47
-
48
-
49
-
50
-
51
-
52
-
53
-
54
-
 55
55 -
 56
56 -
 57
57 -
 58
58 -
 59
59 -
 60
60 -
 61
61 -
 62
62 -
 63
63 -
 64
64 -
 65
65 -
 66
66 -
 67
67 -
 68
68 -
 69
69 -
 70
70 -
 71
71 -
 72
72 -
 73
73 -
 74
74 -
 75
75 -
76
-
77
-
78
-
79
-
80
-
81
-
82
-
83
-
84
-
85
-
86
-
87
-
88
-
89
-
90
-
91
-
92
-
93
-
94
-
95
-
96
-
97
-
98
-
99
-
100
-
101
-
102
-
103
-
104
-
105
-
106
-
107
-
108
-
109
-
110
-
111
-
112
-
113
-
114
-
115
-
116
-
117
-
118
-
119
-
120
-
121
-
122
-
123
-
124
-
125
-
126
-
127
-
128
-
129
-
130
-
131
-
132
-
133
-
134
-
135
-
136
-
137
-
138
-
139
-
140
-
141
-
142
-
143
-
144
-
145
-
146
-
147
-
148
-
149
-
150
-
151
-
152
-
153
 |
 |

Cumulative Effect of Accounting Change, Net of Tax
In the year ended December 31, 2006, we recorded a $1.1 million pre-tax benefit ($1.0 million, net of tax) as the cumulative effect of
accounting change upon the adoption of SFAS No. 123R to recognize the effect of estimating the number of equity awards granted prior to
January 1, 2006 that are not ultimately expected to vest.
Liquidity and Capital Resources
Our total cash, cash equivalent and short-term investments balances increased by $55.9 million, or 34%, to $218.3 million at December 31,
2007, compared to $162.4 million at December 31, 2006. Our summary cash flows for the years ended December 31, 2007, 2006 and 2005 were
as follows (in thousands):
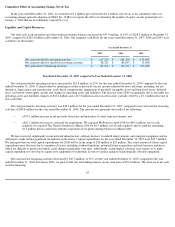
Year Ended December 31, 2007 compared to Year Ended December 31, 2006
Net cash provided by operating activities increased by $25.8 million, or 25%, for the year ended December 31, 2007 compared to the year
ended December 31, 2006. Cash provided by operating activities is driven by our net income adjusted for non-cash items, including, but not
limited to, depreciation and amortization, stock-based compensation, impairment of goodwill, intangible assets and long-lived assets, deferred
taxes, tax benefits from equity awards and changes in operating assets and liabilities. The increase from 2006 was primarily due to favorable net
operating assets and liabilities changes of $18.4 million and a $15.5 million increase in net income, partially offset by a $7.1 million decrease in
non-cash items.
Net cash provided by investing activities was $48.5 million for the year ended December 31, 2007, compared to net cash used for investing
activities of $89.8 million for the year ended December 31, 2006. The increase was primarily the result of the following:
•
Year Ended December 31,
2007
2006
2005
Net cash provided by operating activities
$
127,225
$
101,470
$
137,047
Net cash provided by (used for) investing activities
$
48,526
$
(89,837
)
$
(3,389
)
Net cash used for financing activities
$
(45,561
)
$
(92,725
)
$
(89,643
)
a $73.1 million increase in net proceeds from sales and maturities of short
-
term investments; and
• a $61.2 million decrease in cash paid for acquisitions. We acquired MyPoints in April 2006 for $49.5 million, net of cash
acquired; we acquired The Names Database in March 2006 for $9.5 million, net of cash acquired; and we paid the remaining
$1.5 million due in connection with the acquisition of our photo sharing business in March 2006.
We have invested significantly in our network infrastructure, software licenses, leasehold improvements, and computer equipment and we
will need to make further significant investments in the future. Capital expenditures for the year ended December 31, 2007 were $25.5 million.
We anticipate that our total capital expenditures for 2008 will be in the range of $18 million to $23 million. The actual amount of future capital
expenditures may fluctuate due to a number of factors including, without limitation, potential future acquisitions and new business initiatives,
which are difficult to predict and which could change significantly over time. Additionally, technological advances may require us to make
capital expenditures to develop or acquire new equipment or technology in order to replace aging or technologically obsolete equipment.
Net cash used for financing activities decreased by $47.2 million, or 51%, for the year ended December 31, 2007 compared to the year
ended December 31, 2006. In January 2006, we paid, in full, the outstanding balance on our term loan of $54.2 million. The decrease in net cash
used for financing
62