Classmates.com 2007 Annual Report Download - page 53
Download and view the complete annual report
Please find page 53 of the 2007 Classmates.com annual report below. You can navigate through the pages in the report by either clicking on the pages listed below, or by using the keyword search tool below to find specific information within the annual report.-
 1
1 -
2
-
3
-
4
-
5
-
6
-
7
-
8
-
9
-
10
-
11
-
12
-
13
-
14
-
15
-
16
-
17
-
18
-
19
-
20
-
21
-
22
-
23
-
24
-
25
-
26
-
27
-
28
-
29
-
30
-
31
-
32
-
33
-
34
-
35
-
36
-
37
-
38
-
39
-
40
-
41
-
42
-
 43
43 -
 44
44 -
 45
45 -
 46
46 -
 47
47 -
 48
48 -
 49
49 -
 50
50 -
 51
51 -
 52
52 -
 53
53 -
 54
54 -
 55
55 -
 56
56 -
 57
57 -
 58
58 -
 59
59 -
 60
60 -
 61
61 -
 62
62 -
 63
63 -
64
-
65
-
66
-
67
-
68
-
69
-
70
-
71
-
72
-
73
-
74
-
75
-
76
-
77
-
78
-
79
-
80
-
81
-
82
-
83
-
84
-
85
-
86
-
87
-
88
-
89
-
90
-
91
-
92
-
93
-
94
-
95
-
96
-
97
-
98
-
99
-
100
-
101
-
102
-
103
-
104
-
105
-
106
-
107
-
108
-
109
-
110
-
111
-
112
-
113
-
114
-
115
-
116
-
117
-
118
-
119
-
120
-
121
-
122
-
123
-
124
-
125
-
126
-
127
-
128
-
129
-
130
-
131
-
132
-
133
-
134
-
135
-
136
-
137
-
138
-
139
-
140
-
141
-
142
-
143
-
144
-
145
-
146
-
147
-
148
-
149
-
150
-
151
-
152
-
153
 |
 |

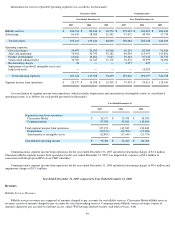
to our loyalty marketing service which has a higher cost of revenues as a percentage of revenues as compared to our social networking services.
The higher cost of revenues associated with our loyalty marketing service is largely due to the benefits provided to our loyalty marketing
members when they redeem points earned in connection with our loyalty marketing service.
Communications Cost of Revenues. Communications cost of revenues decreased by $14.3 million, or 17%, to $69.3 million, or 21.6% of
Communications revenues, for the year ended December 31, 2007, compared to $83.5 million, or 21.8% of Communications revenues, for the
year ended December 31, 2006. The decrease was primarily due to a $15.4 million decrease in telecommunications costs associated with our
dial-up Internet access business due to a decrease in the number of pay accounts, a decrease in hourly usage per pay account as well as lower
average hourly telecommunications costs. In addition, customer support and billing-related costs decreased by $5.4 million in 2007 versus 2006
as a result of a decrease in the number of dial-up Internet access pay accounts and a decrease in the hourly rate charged by our third-party
vendor, and by $2.1 million due to a decrease in costs associated with our VoIP services as a result of our decision during 2007 to exit our VoIP
services. These decreases were partially offset by a $7.4 million increase in costs associated with our DSL Internet access service, which was
launched in the December 2006 quarter.
Sales and Marketing
Sales and marketing expenses include expenses associated with promoting our services and with generating advertising revenues. Expenses
associated with promoting our services include advertising and promotion expenses; fees paid to distribution partners, third-party advertising
networks and co-registration partners to acquire new pay and free accounts; personnel and overhead-related expenses for marketing personnel;
and telemarketing costs incurred to acquire and retain pay accounts and up-sell pay accounts to additional services. Expenses associated with
generating advertising revenues include sales commissions and personnel-related expenses. We have expended significant amounts on sales and
marketing, including branding and customer acquisition campaigns consisting of television, Internet, sponsorships, radio, print and outdoor
advertising, and on retail and other performance-based distribution relationships. Marketing and advertising costs to promote our products and
services are expensed in the period incurred. Advertising and promotion expenses include media, agency and promotion expenses. Media
production costs are expensed the first time the advertisement is run. Media and agency costs are expensed over the period the advertising runs.
Consolidated Sales and Marketing Expenses. Consolidated sales and marketing expenses decreased by $13.6 million, or 8%, to
$163.4 million, or 31.8% of consolidated revenues, for the year ended December 31, 2007, compared to $177.0 million, or 33.9% of
consolidated revenues, for the year ended December 31, 2006. The decrease was primarily attributable to a reduction in marketing expenses
related to our Communications segment, partially offset by an increase in marketing expenses related to our Classmates Media segment. Sales
and marketing expenses related to our Classmates Media segment and our Communications segment constituted 48.4% and 51.6%, respectively,
of total segment sales and marketing expenses for the year ended December 31, 2007 versus 34.4% and 65.6%, respectively, for the year ended
December 31, 2006.
Classmates Media Sales and Marketing Expenses. Classmates Media sales and marketing expenses increased by $18.2 million, or 30%,
to $78.9 million, or 40.8% of Classmates Media revenues, for the year ended December 31, 2007, compared to $60.7 million, or 43.6% of
Classmates Media revenues, for the year ended December 31, 2006. A portion of the increase was related to sales and marketing expenses
associated with our loyalty marketing service, which we acquired in April 2006 and which was included in our results of operations for the full
year ended December 31, 2007 compared to only 266 days for the year ended December 31, 2006. Sales and marketing expenses associated with
our loyalty marketing service increased by $9.5 million in the year ended December 31, 2007 when
50