Classmates.com 2004 Annual Report Download - page 84
Download and view the complete annual report
Please find page 84 of the 2004 Classmates.com annual report below. You can navigate through the pages in the report by either clicking on the pages listed below, or by using the keyword search tool below to find specific information within the annual report.-
 1
1 -
2
-
3
-
4
-
5
-
6
-
7
-
8
-
9
-
10
-
11
-
12
-
13
-
14
-
15
-
16
-
17
-
18
-
19
-
20
-
21
-
22
-
23
-
24
-
25
-
26
-
27
-
28
-
29
-
30
-
31
-
32
-
33
-
34
-
35
-
36
-
37
-
38
-
39
-
40
-
41
-
42
-
43
-
44
-
45
-
46
-
47
-
48
-
49
-
50
-
51
-
52
-
53
-
54
-
55
-
56
-
57
-
58
-
59
-
60
-
61
-
62
-
63
-
64
-
65
-
66
-
67
-
68
-
69
-
70
-
71
-
72
-
73
-
 74
74 -
 75
75 -
 76
76 -
 77
77 -
 78
78 -
 79
79 -
 80
80 -
 81
81 -
 82
82 -
 83
83 -
 84
84 -
 85
85 -
 86
86 -
 87
87 -
 88
88 -
 89
89 -
 90
90 -
 91
91 -
 92
92 -
 93
93 -
 94
94 -
95
-
96
-
97
-
98
-
99
-
100
-
101
-
102
-
103
-
104
-
105
-
106
-
107
-
108
-
109
-
110
-
111
-
112
-
113
-
114
-
115
-
116
-
117
-
118
-
119
-
120
-
121
-
122
-
123
-
124
-
125
-
126
-
127
-
128
-
129
-
130
-
131
-
132
-
133
-
134
 |
 |

the provisions of SFAS No. 123 and EITF Issue No. 96-18, Accounting for Equity Instruments That Are Issued to Other Than Employees for
Acquiring, or in Conjunction with Selling, Goods or Services
. Compensation expense is recorded in accordance with FIN 28, Accounting for
Stock Appreciation Rights and Other Variable Stock Option or Award Plans, an interpretation of APB Opinions No. 15 and 25.
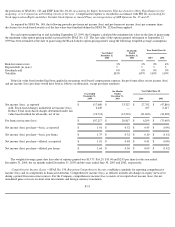
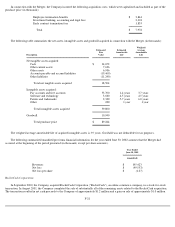
As required by SFAS No. 148, the following provides pro forma net income (loss) and pro forma net income (loss) per common share
disclosures for stock-based awards as if the fair-value-based method defined in SFAS No. 123 had been applied.
For each option granted up to and including September 23, 1999, the Company calculated the minimum fair value on the date of grant using
the minimum value option-pricing model as prescribed by SFAS No. 123. The fair value of the options granted subsequent to September 23,
1999 has been estimated at the date of grant using the Black-Scholes option-pricing model, using the following weighted-average assumptions:
If the fair value based method had been applied in measuring stock-based compensation expense, the pro forma effect on net income (loss)
and net income (loss) per share would have been as follows (in thousands, except per share amounts):
The weighted average grant-date fair value of options granted was $13.75, $16.29, $13.04 and $2.05 per share for the year ended
December 31, 2004, the six months ended December 31, 2003 and the years ended June 30, 2003 and 2002, respectively.
Comprehensive Income (Loss) —SFAS No. 130, Reporting Comprehensive Income, establishes standards for reporting comprehensive
income (loss) and its components in financial statements. Comprehensive income (loss), as defined, includes all changes in equity (net assets)
during a period from non-owner sources. For the Company, comprehensive income (loss) consists of its reported net income (loss), the net
unrealized gains or losses on short-term investments and foreign currency translation.
F-15
Year Ended June 30,
Six Months
Ended
December 31,
2003
Year Ended
December 31,
2004
2003
2002
Risk
-
free interest rate
3
%
3
%
2
%
4
%
Expected life (in years)
5
5
5
5
Dividend yield
0
%
0
%
0
%
0
%
Volatility
103
%
107
%
110
%
110
%
Six Months
Ended
December 31,
2003
Year Ended June 30,
Year Ended
December 31,
2004
2003
2002
Net income (loss), as reported
$
117,480
$
33,327
$
27,792
$
(47,810
)
Add: Stock
-
based charges included in net income (loss)
2,449
—
107
6,417
Deduct: Total stock-based charges determined under fair
value
-
based method for all awards, net of tax
(12,712
)
(12,510
)
(21,600
)
(34,302
)
Pro forma net income (loss)
$
107,217
$
20,817
$
6,299
$
(75,695
)
Net income (loss) per share
—
basic, as reported
$
1.91
$
0.52
$
0.45
$
(0.90
)
Net income (loss) per share
—
basic, pro forma
$
1.75
$
0.32
$
0.10
$
(1.42
)
Net income (loss) per share
—
diluted, as reported
$
1.81
$
0.48
$
0.41
$
(0.90
)
Net income (loss) per share
—
diluted, pro forma
$
1.64
$
0.30
$
0.09
$
(1.42
)