Classmates.com 2004 Annual Report Download - page 36
Download and view the complete annual report
Please find page 36 of the 2004 Classmates.com annual report below. You can navigate through the pages in the report by either clicking on the pages listed below, or by using the keyword search tool below to find specific information within the annual report.-
 1
1 -
2
-
3
-
4
-
5
-
6
-
7
-
8
-
9
-
10
-
11
-
12
-
13
-
14
-
15
-
16
-
17
-
18
-
19
-
20
-
21
-
22
-
23
-
24
-
25
-
 26
26 -
 27
27 -
 28
28 -
 29
29 -
 30
30 -
 31
31 -
 32
32 -
 33
33 -
 34
34 -
 35
35 -
 36
36 -
 37
37 -
 38
38 -
 39
39 -
 40
40 -
 41
41 -
 42
42 -
 43
43 -
 44
44 -
 45
45 -
 46
46 -
47
-
48
-
49
-
50
-
51
-
52
-
53
-
54
-
55
-
56
-
57
-
58
-
59
-
60
-
61
-
62
-
63
-
64
-
65
-
66
-
67
-
68
-
69
-
70
-
71
-
72
-
73
-
74
-
75
-
76
-
77
-
78
-
79
-
80
-
81
-
82
-
83
-
84
-
85
-
86
-
87
-
88
-
89
-
90
-
91
-
92
-
93
-
94
-
95
-
96
-
97
-
98
-
99
-
100
-
101
-
102
-
103
-
104
-
105
-
106
-
107
-
108
-
109
-
110
-
111
-
112
-
113
-
114
-
115
-
116
-
117
-
118
-
119
-
120
-
121
-
122
-
123
-
124
-
125
-
126
-
127
-
128
-
129
-
130
-
131
-
132
-
133
-
134
 |
 |

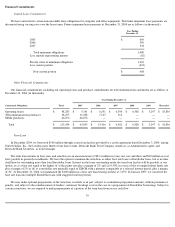
allocated to billable services decreased due to assets placed in service in prior years becoming fully depreciated and significantly lower levels of
capital expenditure in recent years versus prior years.
Cost of billable services as a percentage of billable services revenues was 36% in the year ended June 30, 2003, compared to 53% in the
year ended June 30, 2002. Cost of billable services as a percentage of billable services revenues decreased as a result of decreased hourly
telecommunications costs, decreased customer billing and support costs per pay account and decreased depreciation expense, which were
partially offset by an increase in average hourly usage per pay account. Customer billing and support costs per pay account decreased as a result
of cost savings gained through the consolidation of NetZero's and Juno's customer billing and support functions, which resulted in better pricing
from our primary customer support vendor as a result of increased call volumes.
Cost of Free Services
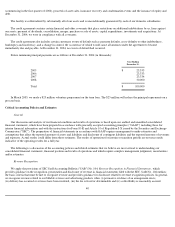
Cost of free services decreased by $20.5 million, or 62%, to $12.6 million for the year ended June 30, 2003, compared to $33.1 million for
the year ended June 30, 2002. The decrease was due to a $16.6 million decrease in telecommunications costs, a $3.0 million decrease in network
depreciation allocated to free services and a $0.9 million net decrease in network personnel and overhead-related costs allocated to free services.
The decrease in telecommunications costs was a result of a decrease in average hourly telecommunications costs, a decrease in the number of
active free accounts and a decrease in the average hourly usage of our free accounts, which resulted from hourly limitations imposed on our free
services. Our active free account base consisted of approximately 2.6 million users at June 30, 2003, compared to approximately 3.1 million
users at June 30, 2002. This decrease primarily resulted from free accounts upgrading to our pay services and fewer new accounts signing up for
our free services as a result of usage and geographical limitations imposed on our free services in the year ended June 30, 2002 and a reduced
emphasis on marketing our free services. Depreciation expense allocated to free services has decreased due to assets placed in service in prior
years becoming fully depreciated, significantly lower levels of capital expenditures in recent years versus prior years and a decrease in free
accounts as a percentage of total free accounts and pay accounts. Telecommunication hours allocated to our free account base decreased to
approximately 15% of total telecommunications hours purchased during the year ended June 30, 2003, compared to approximately 37% during
the year ended June 30, 2002.
Sales and Marketing
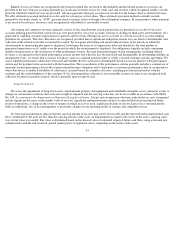
Sales and marketing expenses increased by $46.4 million, or 115%, to $86.6 million for the year ended June 30, 2003, compared to
$40.2 million for the year ended June 30, 2002. The increase was attributable to a $42.3 million increase in marketing and promotion costs. The
increase in marketing and promotion costs was a result of the utilization of expanded marketing initiatives that focus on increasing our pay
account base and building our brands. Additionally, sales and marketing expenses increased as a result of a $4.8 million increase in
telemarketing expenses related to customer acquisition and retention activities and a $0.5 million increase in personnel and overhead-related
expenses due to increased headcount and compensation costs in our sales and marketing department. These increases were partially offset by a
$0.7 million decrease in costs directly associated with our former RocketCash subsidiary, which was sold in August 2001, and a $0.5 million
decrease in stock-based charges.
Product Development
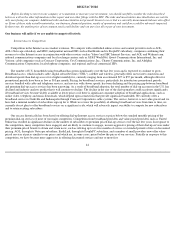
Product development expenses decreased by $1.7 million, or 7%, to $23.1 million for the year ended June 30, 2003, compared to
$24.8 million for the year ended June 30, 2002. The decrease was due to a $1.8 million decrease in stock-based charges, a $1.6 million decrease
in depreciation expense and a $1.1 million decrease in costs directly associated with our former RocketCash and Simpli
34