Classmates.com 2004 Annual Report Download - page 24
Download and view the complete annual report
Please find page 24 of the 2004 Classmates.com annual report below. You can navigate through the pages in the report by either clicking on the pages listed below, or by using the keyword search tool below to find specific information within the annual report.-
 1
1 -
2
-
3
-
4
-
5
-
6
-
7
-
8
-
9
-
10
-
11
-
12
-
13
-
 14
14 -
 15
15 -
 16
16 -
 17
17 -
 18
18 -
 19
19 -
 20
20 -
 21
21 -
 22
22 -
 23
23 -
 24
24 -
 25
25 -
 26
26 -
 27
27 -
 28
28 -
 29
29 -
 30
30 -
 31
31 -
 32
32 -
 33
33 -
 34
34 -
35
-
36
-
37
-
38
-
39
-
40
-
41
-
42
-
43
-
44
-
45
-
46
-
47
-
48
-
49
-
50
-
51
-
52
-
53
-
54
-
55
-
56
-
57
-
58
-
59
-
60
-
61
-
62
-
63
-
64
-
65
-
66
-
67
-
68
-
69
-
70
-
71
-
72
-
73
-
74
-
75
-
76
-
77
-
78
-
79
-
80
-
81
-
82
-
83
-
84
-
85
-
86
-
87
-
88
-
89
-
90
-
91
-
92
-
93
-
94
-
95
-
96
-
97
-
98
-
99
-
100
-
101
-
102
-
103
-
104
-
105
-
106
-
107
-
108
-
109
-
110
-
111
-
112
-
113
-
114
-
115
-
116
-
117
-
118
-
119
-
120
-
121
-
122
-
123
-
124
-
125
-
126
-
127
-
128
-
129
-
130
-
131
-
132
-
133
-
134
 |
 |

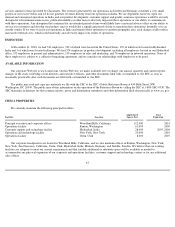
Web-hosting and domain name registration business of About Web Services, Inc. Our corporate headquarters are located in Woodland Hills,
California.
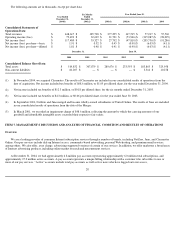
Results of Operations
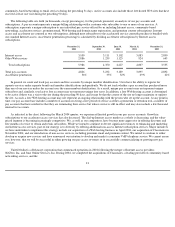
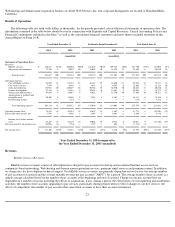
The following table sets forth (with dollars in thousands), for the periods presented, selected historical statements of operations data. The
information contained in the table below should be read in conjunction with Liquidity and Capital Resources, Critical Accounting Policies and
Financial Commitments included in this Item 7 as well as the consolidated financial statements and notes thereto included elsewhere in this
Annual Report on Form 10-K.
Year Ended December 31, 2004 compared to
the Year Ended December 31, 2003 (unaudited)
Revenues
Billable Services Revenues
Billable services revenues consist of subscription fees charged to pay accounts for dial-up and accelerated Internet access services,
community-based networking, Web-hosting and domain name registration services, premium email services and premium content. In addition,
we charge fees for live telephone technical support. Our billable services revenues are primarily dependent on two factors: the average number
of pay accounts for a period and the average monthly revenue per pay account ("ARPU") for a period. The average number of pay accounts is a
simple average calculated based on the number of pay accounts at the beginning and end of a period. Changes in our pay account base are
dependent on a number of factors including the effects of acquisitions, if any, during a period; the effectiveness of our marketing and distribution
activities; the number of free accounts upgrading to pay services, particularly during periods when we effect changes to our free services; the
effects of competition; the number of pay accounts that cancel their accounts or have their accounts terminated;
22
Year Ended December 31,
Six Months Ended December 31,
Year Ended June 30,
2004
2003
2003
2002
2003
2002
(unaudited)
(unaudited)
Statements of Operations Data:
Revenues:
Billable services
$
410,821
92
%
$
306,086
90
%
$
167,639
90
%
$
109,343
88
%
$
247,790
89
%
$
141,005
84
%
Advertising and commerce
37,796
8
33,079
10
18,099
10
14,525
12
29,505
11
26,510
16
Total revenues
448,617
100
339,165
100
185,738
100
123,868
100
277,295
100
167,515
100
Operating expenses:
Cost of billable services
94,999
21
92,785
27
46,182
25
42,690
34
89,293
32
74,227
44
Cost of free services
7,393
2
9,659
3
3,953
2
6,897
6
12,603
5
33,129
20
Sales and marketing
178,981
40
120,619
36
70,526
38
36,530
30
86,623
31
40,220
24
Product development
27,454
6
21,881
6
10,488
6
11,661
9
23,054
8
24,779
15
General and administrative
39,894
9
29,087
9
14,022
7
12,740
10
27,805
10
30,722
18
Amortization of goodwill and
intangible assets
20,403
5
15,856
5
7,928
4
8,483
7
16,411
6
14,156
8
Restructuring charges
—
—
(
215
)
—
—
—
—
—
(
215
)
—
4,228
3
Total operating expenses
369,124
82
289,672
85
153,099
82
119,001
96
255,574
92
221,461
132
Operating income (loss)
79,493
18
49,493
15
32,639
18
4,867
4
21,721
8
(53,946
)
(32
)
Interest and other income, net
3,936
1
4,636
1
2,407
1
2,061
2
4,290
1
6,136
3
Income (loss) before income
taxes
83,429
19
54,129
16
35,046
19
6,928
6
26,011
9
(47,810
)
(29
)
Provision (benefit) for income taxes
(34,051
)
(8
)
(754
)
—
1,719
1
692
1
(1,781
)
(1
)
—
—
Net income (loss)
$
117,480
26
%
$
54,883
16
%
$
33,327
18
%
$
6,236
5
%
$
27,792
10
%
$
(47,810
)
(29
)%