Classmates.com 2004 Annual Report Download - page 31
Download and view the complete annual report
Please find page 31 of the 2004 Classmates.com annual report below. You can navigate through the pages in the report by either clicking on the pages listed below, or by using the keyword search tool below to find specific information within the annual report.-
 1
1 -
2
-
3
-
4
-
5
-
6
-
7
-
8
-
9
-
10
-
11
-
12
-
13
-
14
-
15
-
16
-
17
-
18
-
19
-
20
-
 21
21 -
 22
22 -
 23
23 -
 24
24 -
 25
25 -
 26
26 -
 27
27 -
 28
28 -
 29
29 -
 30
30 -
 31
31 -
 32
32 -
 33
33 -
 34
34 -
 35
35 -
 36
36 -
 37
37 -
 38
38 -
 39
39 -
 40
40 -
 41
41 -
42
-
43
-
44
-
45
-
46
-
47
-
48
-
49
-
50
-
51
-
52
-
53
-
54
-
55
-
56
-
57
-
58
-
59
-
60
-
61
-
62
-
63
-
64
-
65
-
66
-
67
-
68
-
69
-
70
-
71
-
72
-
73
-
74
-
75
-
76
-
77
-
78
-
79
-
80
-
81
-
82
-
83
-
84
-
85
-
86
-
87
-
88
-
89
-
90
-
91
-
92
-
93
-
94
-
95
-
96
-
97
-
98
-
99
-
100
-
101
-
102
-
103
-
104
-
105
-
106
-
107
-
108
-
109
-
110
-
111
-
112
-
113
-
114
-
115
-
116
-
117
-
118
-
119
-
120
-
121
-
122
-
123
-
124
-
125
-
126
-
127
-
128
-
129
-
130
-
131
-
132
-
133
-
134
 |
 |

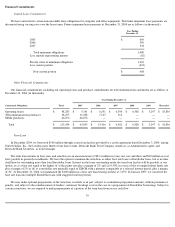
Consistent with prior periods, in determining the need for a valuation allowance related to our deferred tax assets at December 31, 2004, we
reviewed both positive and negative evidence pursuant to the requirements of SFAS No. 109, Accounting for Income Taxes , including current
and historical results of operations, the annual limitation on utilization of net operating loss carryforwards pursuant to Internal Revenue Code
(the "Code") Section 382, future income projections and potential tax-planning strategies. Based upon our assessment of all available evidence,
we concluded that, primarily with the exception of certain foreign net operating losses, it is more likely than not that the remaining deferred tax
assets will be realized. This conclusion is based primarily on our trend of profitable operations and financial projections to generate significant
amounts of taxable income in future periods, on a consistent and prolonged basis, in order to utilize the remaining deferred tax assets. We will
continue to monitor all available evidence and assess our deferred tax assets.
At December 31, 2004 we had net operating loss and tax credit carryforwards for federal and state income tax purposes of approximately
$235 million and $300 million, respectively, which begin to expire in 2018 and 2007, respectively. With respect to the state net operating losses,
certain amounts will be further reduced pursuant to the state allocation and apportionment laws. These carryforwards have been adjusted to
reflect limitations under Section 382 of the Code.
Six Months Ended December 31, 2003 Compared to
the Six Months Ended December 31, 2002 (unaudited)
Revenues
Billable Services Revenues
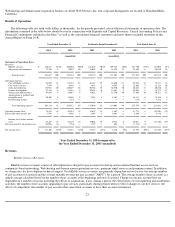
Billable services revenues increased by $58.3 million, or 53%, to $167.6 million for the six months ended December 31, 2003, compared to
$109.3 million for the six months ended December 31, 2002. The increase was due to an increase in our average number of pay accounts and an
increase in our ARPU. Our average number of pay accounts was approximately 2,720,000 during the six months ended December 31, 2003,
compared to approximately 1,942,000 for the six months ended December 31, 2002. The increase in our average number of pay accounts
resulted from a number of factors including increased marketing and promotion of our pay services, the acquisition of approximately 174,000
pay accounts from BlueLight in November 2002 and a significant number of our free users upgrading to our pay access services. ARPU was
$10.27 for the six months ended December 31, 2003, compared to $9.39 for the six months ended December 31, 2002. The increase in ARPU
was due to an increase in the number of access accounts purchasing our accelerator services, which were introduced in March 2003 and are
offered for an additional $5.00 per month, or a total monthly charge of $14.95, compared to $9.95 per month for our standard dial-
up services. In
addition, the ARPU for the six months ended December 31, 2002 was negatively impacted by the acquisition of approximately 174,000 pay
accounts from BlueLight at the end of November 2002. At December 31, 2003, subscriptions to our accelerated dial-up services comprised
approximately 22% of our total pay account base.
Advertising and Commerce Revenues
Advertising and commerce revenues increased by $3.6 million, or 25%, to $18.1 million for the six months ended December 31, 2003,
compared to $14.5 million for the six months ended December 31, 2002. The increase was primarily due to higher advertising revenues
generated from our advertising agreement with GM and an increase in fees derived from our Internet search partners. We derived approximately
44% of our advertising and commerce revenues for the six months ended December 31, 2003 from GM, compared to approximately 36% for the
six months ended December 31, 2002. The increase in advertising revenues from GM was partially a result of a $1.5 million performance bonus
earned during the September 2003 quarter. We derived approximately 21% and 19% of our advertising and commerce revenues, respectively, for
the six months ended December 31, 2003 and 2002 from
29