Classmates.com 2004 Annual Report Download - page 39
Download and view the complete annual report
Please find page 39 of the 2004 Classmates.com annual report below. You can navigate through the pages in the report by either clicking on the pages listed below, or by using the keyword search tool below to find specific information within the annual report.-
 1
1 -
2
-
3
-
4
-
5
-
6
-
7
-
8
-
9
-
10
-
11
-
12
-
13
-
14
-
15
-
16
-
17
-
18
-
19
-
20
-
21
-
22
-
23
-
24
-
25
-
26
-
27
-
28
-
 29
29 -
 30
30 -
 31
31 -
 32
32 -
 33
33 -
 34
34 -
 35
35 -
 36
36 -
 37
37 -
 38
38 -
 39
39 -
 40
40 -
 41
41 -
 42
42 -
 43
43 -
 44
44 -
 45
45 -
 46
46 -
 47
47 -
 48
48 -
 49
49 -
50
-
51
-
52
-
53
-
54
-
55
-
56
-
57
-
58
-
59
-
60
-
61
-
62
-
63
-
64
-
65
-
66
-
67
-
68
-
69
-
70
-
71
-
72
-
73
-
74
-
75
-
76
-
77
-
78
-
79
-
80
-
81
-
82
-
83
-
84
-
85
-
86
-
87
-
88
-
89
-
90
-
91
-
92
-
93
-
94
-
95
-
96
-
97
-
98
-
99
-
100
-
101
-
102
-
103
-
104
-
105
-
106
-
107
-
108
-
109
-
110
-
111
-
112
-
113
-
114
-
115
-
116
-
117
-
118
-
119
-
120
-
121
-
122
-
123
-
124
-
125
-
126
-
127
-
128
-
129
-
130
-
131
-
132
-
133
-
134
 |
 |

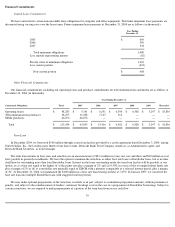
Liquidity and Capital Resources
Our total cash, cash equivalent and short-term investment balances increased by approximately $29.1 million to $232.8 million at
December 31, 2004 compared to $203.7 million at December 31, 2003. Our summary cash flows for the periods were as follows (in thousands):
Net cash provided by operating activities increased by $40.5 million, or 49%, for the year ended December 31, 2004 compared to the year
ended December 31, 2003. Significant factors that have impacted the variability in our cash provided by operating activities in these periods are
as follows:
•
Year Ended
June 30,
Year Ended
December 31,
2004
Year Ended
December 31,
2003
Six Months
Ended
December 31,
2003
2003
2002
(unaudited)
Net cash provided by (used for) operating
activities
$
123,960
$
83,464
$
47,892
$
65,106
$
(4,553
)
Net cash used for investing activities
(108,010
)
(57,936
)
(25,886
)
(79,643
)
(16,961
)
Net cash provided by (used for) financing
activities
31,654
(29,771
)
(29,386
)
(268
)
(7,480
)
increases in operating income before depreciation, amortization and stock-based compensation as a result of increased revenue
and operating profitability due to overall improvements in our business;
• the utilization of net operating loss and tax credit carryforwards and income tax deductions resulting from the exercise of stock
options by employees, which have reduced payments for income taxes. We currently anticipate that our net operating loss and tax
credit carryforwards available for use in 2005, when combined with anticipated exercises of employee stock options, will help to
reduce the level of cash paid for income taxes in 2005. However, we believe that cash paid for income taxes in 2005 will be
significantly higher than the $2.9 million paid in 2004. We have approximately $41 million of net operating loss carryforwards
available in 2005, $17 million in 2006 and $13 million in 2007 through 2020; and
• changes in working capital accounts due to increases in revenue and operating expenses and the timing of related cash receipts
and payments.
Net cash used for investing activities increased by $50.1 million, or 86%, for the year ended December 31, 2004 compared to the year
ended December 31, 2003. Significant factors that have impacted the variability in our cash used for investing activities in these periods are as
follows:
•
the acquisition of the Web
-
hosting services assets of About, Inc. in April 2004 for $11.9 million in cash and the acquisition of
Classmates in November 2004 for $98.2 million in cash, net of cash acquired;
• changes in our short-term investment portfolio based on the liquidity requirements of our business; and
•
increases in capital equipment purchases in connection with the ongoing operation of our business and the relocation of our
corporate offices.
In prior years, we have invested significantly in our network infrastructure, software licenses, leasehold improvements, and computer
equipment and we will need to make further significant investments in the future. Capital expenditures for the year ended December 31, 2004
were $12.5 million. We anticipate that our total capital expenditures for 2005 will be in the range of $15 million to $25 million, excluding the
purchase of an intangible asset for $6.0 million in January 2005. The actual amount of future capital expenditures may fluctuate due to a number
of factors including, without limitation, potential future acquisitions and new business initiatives, including
37