Classmates.com 2004 Annual Report Download - page 27
Download and view the complete annual report
Please find page 27 of the 2004 Classmates.com annual report below. You can navigate through the pages in the report by either clicking on the pages listed below, or by using the keyword search tool below to find specific information within the annual report.-
 1
1 -
2
-
3
-
4
-
5
-
6
-
7
-
8
-
9
-
10
-
11
-
12
-
13
-
14
-
15
-
16
-
 17
17 -
 18
18 -
 19
19 -
 20
20 -
 21
21 -
 22
22 -
 23
23 -
 24
24 -
 25
25 -
 26
26 -
 27
27 -
 28
28 -
 29
29 -
 30
30 -
 31
31 -
 32
32 -
 33
33 -
 34
34 -
 35
35 -
 36
36 -
 37
37 -
38
-
39
-
40
-
41
-
42
-
43
-
44
-
45
-
46
-
47
-
48
-
49
-
50
-
51
-
52
-
53
-
54
-
55
-
56
-
57
-
58
-
59
-
60
-
61
-
62
-
63
-
64
-
65
-
66
-
67
-
68
-
69
-
70
-
71
-
72
-
73
-
74
-
75
-
76
-
77
-
78
-
79
-
80
-
81
-
82
-
83
-
84
-
85
-
86
-
87
-
88
-
89
-
90
-
91
-
92
-
93
-
94
-
95
-
96
-
97
-
98
-
99
-
100
-
101
-
102
-
103
-
104
-
105
-
106
-
107
-
108
-
109
-
110
-
111
-
112
-
113
-
114
-
115
-
116
-
117
-
118
-
119
-
120
-
121
-
122
-
123
-
124
-
125
-
126
-
127
-
128
-
129
-
130
-
131
-
132
-
133
-
134
 |
 |

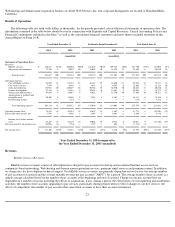
increase in the number of pay access accounts. Our average hourly telecommunications costs decreased as a result of better port utilization,
improvements made in allocating our telecommunications usage to our lower cost vendors and lower telecommunications prices.
Telecommunications hours allocated to our pay access account base increased to approximately 94% of total telecommunications hours
purchased during the year ended December 31, 2004, compared to approximately 88% during the year ended December 31, 2003. Cost of
billable services could increase as a percentage of revenues in 2005 as a result of increased compensation expense recognized in connection with
the adoption of Statement of Financial Accounting Standards ("SFAS") No. 123 (revised), Share-Based Payment , commencing no later than the
September 2005 quarter.
Cost of billable services as a percentage of billable services revenues was 23.1% in the year ended December 31, 2004, compared to 30.3%
in the year ended December 31, 2003. The decrease resulted from a decrease in average hourly telecommunications costs per pay access account;
decreased customer billing and support costs per pay account primarily as a result of better pricing obtained from our principal customer support
vendor; and a decrease in average hourly usage per pay access account.
Our cost of billable services as a percentage of billable services revenues is highly dependent on the pricing for our services, our average
hourly telecommunications cost and usage and our average customer billing and support costs per pay account. If we are not successful in
continuing to increase the percentage of our pay access accounts subscribing to our accelerated services, or increase the percentage of our pay
account base subscribing to higher margin services including our Web-hosting and community-based networking services, or if due to
competitive or other factors we decrease the pricing for our access or other services or increase the use of promotions such as one or more free
months of service, or if our new pay services are less profitable than our existing pay services, it is likely that our cost of billable services as a
percentage of billable services revenues would be adversely impacted. While our average hourly telecommunications costs have decreased for
some time, we may experience increased average hourly telecommunications costs in future periods, particularly if we expand our service
coverage to additional geographic areas where telecommunications costs are higher. Additionally, while the average hourly usage of our pay
access accounts decreased in the year ended December 31, 2004 compared to the year ended December 31, 2003, we may experience increased
average hourly usage in future periods when compared to the comparable period of the prior year, which would adversely impact this percentage.
Cost of Free Services
Cost of free services includes direct costs and costs that have been allocated to free services. Allocated costs consist primarily of
telecommunications and data center costs, personnel and overhead-related costs associated with operating our network and data centers,
depreciation of network computers and equipment and email technical support. We allocate costs associated with access services between pay
services and free services based on the aggregate hourly usage of our free access accounts as a percentage of total hours used by our active
access accounts. We allocate costs associated with Web hosting between pay services and free services based on estimated bandwidth used by
free Web-hosting accounts. Costs associated with our community-based networking services are allocated based on the number of Web site
visits by free accounts relative to the total number of user visits.
Cost of free services decreased by $2.3 million, or 23%, to $7.4 million for the year ended December 31, 2004, compared to $9.7 million
for the year ended December 31, 2003. The decrease was due primarily to a $2.5 million decrease in telecommunications costs. The decrease in
telecommunications costs is a result of a decrease in average hourly telecommunications costs, a decrease in the number of active free access
accounts and a decrease in the average hourly usage of these accounts. The decrease in free access accounts resulted from free accounts
upgrading to our pay services and fewer new free account sign-
ups. Telecommunications hours allocated to our free access accounts decreased to
approximately 6% of total telecommunications hours purchased during the year
25