CarMax 2005 Annual Report Download - page 6
Download and view the complete annual report
Please find page 6 of the 2005 CarMax annual report below. You can navigate through the pages in the report by either clicking on the pages listed below, or by using the keyword search tool below to find specific information within the annual report.-
 1
1 -
 2
2 -
 3
3 -
 4
4 -
 5
5 -
 6
6 -
 7
7 -
 8
8 -
 9
9 -
 10
10 -
 11
11 -
 12
12 -
 13
13 -
 14
14 -
 15
15 -
 16
16 -
 17
17 -
18
-
19
-
20
-
21
-
22
-
23
-
24
-
25
-
26
-
27
-
28
-
29
-
30
-
31
-
32
-
33
-
34
-
35
-
36
-
37
-
38
-
39
-
40
-
41
-
42
-
43
-
44
-
45
-
46
-
47
-
48
-
49
-
50
-
51
-
52
 |
 |

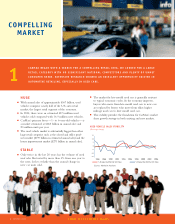
COMPELLING
MARKET
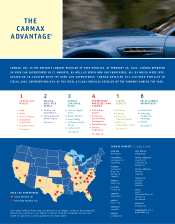
CARMAX BEGAN WITH A SEARCH FOR A COMPELLING RETAIL IDEA. WE LOOKED FOR A LARGE
RETAIL CATEGORY WITH NO SIGNIFICANT NATIONAL COMPETITORS AND PLENTY OF UNMET
CONSUMER NEEDS. EXTENSIVE RESEARCH SHOWED AN EXCELLENT OPPORTUNITY EXISTED IN
AUTOMOTIVE RETAILING, ESPECIALLY IN USED CARS.
1
HUGE
■With annual sales of approximately $367 billion, used
vehicles comprise nearly half of the U.S. auto retail
market, the largest retail segment of the economy.
■In 2004, there were an estimated 42.5 million used
vehicles sold compared with 16.9 million new vehicles.
■CarMax’s primary focus—1- to 6-year-old vehicles—is
a market estimated at $265 billion in annual sales and
20 million units per year.
■The used vehicle market is substantially bigger than other
large retail categories such as the school and office prod-
ucts market ($199 billion in estimated annual sales) and the
home improvement market ($271 billion in annual sales).
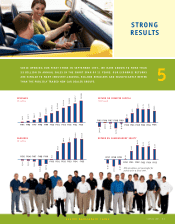
STABLE
■Only twice in the last 20 years has the volume of used
unit sales fluctuated by more than 3% from one year to
the next, far less volatile than the annual change in
new car units sold.
■The market for late-model used cars is generally resistant
to typical economic cycles. As the economy improves,
buyers who move from late-model used cars to new cars
are replaced by buyers who move from older, higher
mileage used cars to later model used cars.
■This stability provides the foundation for CarMax’s market
share growth strategy in both existing and new markets.
-15
-10
-5
0
5
10
15
% Change Used Vehicle Unit Sales % Change New Vehicle Unit Sales
2004200220001998199619941992199019881986
USED VEHICLE SALES STABILITY
(Percentage change)
Source: Manheim Auctions
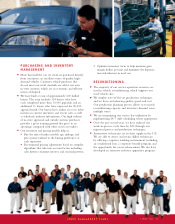
STORE MANAGEMENT TEAMS
4
CARMAX 2005