CarMax 2005 Annual Report Download - page 26
Download and view the complete annual report
Please find page 26 of the 2005 CarMax annual report below. You can navigate through the pages in the report by either clicking on the pages listed below, or by using the keyword search tool below to find specific information within the annual report.-
 1
1 -
2
-
3
-
4
-
5
-
6
-
7
-
8
-
9
-
10
-
11
-
12
-
13
-
14
-
15
-
 16
16 -
 17
17 -
 18
18 -
 19
19 -
 20
20 -
 21
21 -
 22
22 -
 23
23 -
 24
24 -
 25
25 -
 26
26 -
 27
27 -
 28
28 -
 29
29 -
 30
30 -
 31
31 -
 32
32 -
 33
33 -
 34
34 -
 35
35 -
 36
36 -
37
-
38
-
39
-
40
-
41
-
42
-
43
-
44
-
45
-
46
-
47
-
48
-
49
-
50
-
51
-
52
 |
 |

24
CARMAX 2005
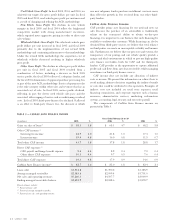
Selling, General, and Administrative Expenses
The SG&A ratio was 10.4% in fiscal 2005, 10.2% in fiscal 2004,
and 9.9% in fiscal 2003. As anticipated, the fiscal 2005, 2004,
and 2003 SG&A ratios were adversely affected by the
continuation of our store growth plan. During these three
years, newer stores comprised an increasing percentage of our
store base. New stores typically experience higher SG&A ratios
during their first several years of operation. Additionally, the
increase in the fiscal 2005 SG&A ratio reflects the deleveraging
impact of lower comparable store unit sales experienced during
the first half of the fiscal year.
The increases in the fiscal 2005, fiscal 2004, and fiscal 2003
SG&A ratios also reflect the expected higher level of operating
expenses associated with being a standalone company following
the October 1, 2002, separation from Circuit City. We estimate
standalone costs were approximately $3.0 million to $4.0
million higher in fiscal 2005 than in fiscal 2004, and
approximately $13.5 million higher in fiscal 2004 than in fiscal
2003. A majority of these costs related to employee benefits and
insurance. The SG&A ratio for fiscal 2003 also included costs of
$7.8 million associated with the separation of CarMax from
Circuit City. Excluding these costs, the SG&A ratio would have
been 9.7% in fiscal 2003.
Accounting for Leases
In February 2005, the Securities and Exchange Commission
(“SEC”) issued an open letter addressing issues regarding
public companies’ accounting for leases and leasing activities.
Of specific concern to the SEC were the appropriate
accounting for the amortization of leasehold improvements,
periods of free or reduced rents (“rent holidays”), and
incentives provided by a lessor related to leasehold
improvements. CarMax has reviewed its accounting for leases
with regard to the SEC’s specific concerns and compliance
with generally accepted accounting principles. As a result of
our review, in the fourth quarter of fiscal 2005, we recognized
cumulative expenses of $1.5 million before tax, or $0.01 per
share, and recorded capital lease obligations and property and
equipment of approximately $17.3 million. The impact on
our consolidated financial statements for fiscal 2005 and prior
fiscal years was immaterial.
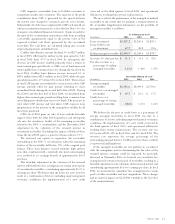
Income Taxes
The effective income tax rate was 38.8% in fiscal year 2005,
38.5% in fiscal 2004, and 39.5% in fiscal 2003. The fiscal 2005
increase resulted from geographic expansion into states with
higher income tax rates, including having a larger percentage of
stores located in unitary tax states. The higher fiscal 2003
effective tax rate included the impact of non-tax-deductible
costs associated with the October 1, 2002, separation from
Circuit City.
OPERATIONS OUTLOOK
Changes in Store Base
During the fiscal year ending February 28, 2006, we plan to
expand our used car superstore base by approximately 16%,
opening nine used car superstores. Planned entries into new
mid-sized markets include Jacksonville, Fla.;Wichita, Kans.; Salt
Lake City, Utah; and Virginia Beach, Va. Satellite superstore
additions are planned for Miami, Fla.; Kansas City, Mo.; and
Nashville, Tenn. In early fiscal 2006, we added a standard
superstore and a satellite superstore in the Los Angeles market.
Fiscal 2006 Expectations
The fiscal 2006 expectations discussed below are based on
historical and current trends in our business and should be read
in conjunction with the “Cautionary Information About
Forward-Looking Statements” section of this MD&A.
Fiscal 2006 Comparable Store Used Unit Growth. Assuming
continuing healthy sales performance, we expect fiscal 2006
comparable store used unit growth in the range of 5% to 9%.
We expect that the growth will be stronger in the first half of
the fiscal year due to the relatively low level of comparable store
used unit sales performance in the first half of fiscal 2005. Some
of the economic and market factors that may have affected our
sales in the first half of fiscal 2005 are still present in the market,
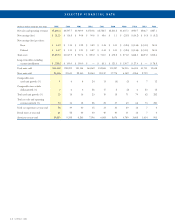
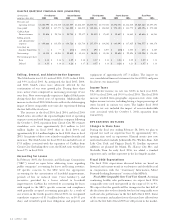
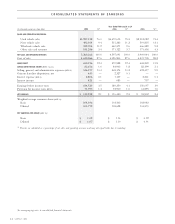
SELECTED QUARTERLY FINANCIAL DATA (UNAUDITED)
(In thousands First Quarter Second Quarter Third Quarter Fourth Quarter Fiscal Year
except per share data) 2005 2004 2005 2004 2005 2004 2005 2004 2005 2004
Net sales and
operating revenues $1,324,990 $1,172,835 $1,323,507 $1,236,457 $1,215,711 $1,071,534 $1,396,054 $1,116,865 $5,260,262 $4,597,691
Gross profit $ 167,230 $ 147,771 $ 163,200 $ 163,105 $ 145,446 $ 126,242 $ 174,320 $ 133,770 $ 650,196 $ 570,888
CarMax Auto
Finance income $ 21,816 $ 25,748 $ 20,744 $ 22,677 $ 20,439 $ 17,649 $ 19,657 $ 18,889 $ 82,656 $ 84,963
Selling, general,
and administrative
expenses $ 130,688 $ 115,553 $ 134,726 $ 120,714 $ 137,170 $ 114,282 $ 143,993 $ 117,825 $ 546,577 $ 468,374
Gain (loss) on
franchise dispositions $—$—$ (11) $ (460) $ 692 $ 1,207 $ (48) $ 1,580 $ 633 $ 2,327
Net earnings $ 35,330 $ 35,260 $ 29,859 $ 39,610 $ 18,045 $ 19,053 $ 29,694 $ 22,526 $ 112,928 $ 116,450
Net earnings per share:
Basic $ 0.34 $ 0.34 $ 0.29 $ 0.38 $ 0.17 $ 0.18 $ 0.28 $ 0.22 $ 1.09 $ 1.13
Diluted $ 0.33 $ 0.34 $ 0.28 $ 0.37 $ 0.17 $ 0.18 $ 0.28 $ 0.21 $ 1.07 $ 1.10