CarMax 2005 Annual Report Download - page 22
Download and view the complete annual report
Please find page 22 of the 2005 CarMax annual report below. You can navigate through the pages in the report by either clicking on the pages listed below, or by using the keyword search tool below to find specific information within the annual report.-
 1
1 -
2
-
3
-
4
-
5
-
6
-
7
-
8
-
9
-
10
-
11
-
 12
12 -
 13
13 -
 14
14 -
 15
15 -
 16
16 -
 17
17 -
 18
18 -
 19
19 -
 20
20 -
 21
21 -
 22
22 -
 23
23 -
 24
24 -
 25
25 -
 26
26 -
 27
27 -
 28
28 -
 29
29 -
 30
30 -
 31
31 -
 32
32 -
33
-
34
-
35
-
36
-
37
-
38
-
39
-
40
-
41
-
42
-
43
-
44
-
45
-
46
-
47
-
48
-
49
-
50
-
51
-
52
 |
 |

20
CARMAX 2005
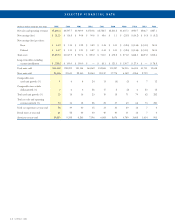
Retail vehicle sales changes were as follows:
Years Ended February 28 or 29
2005 2004 2003
Vehicle units:
Used vehicles 13 % 18 % 16 %
New vehicles (5)% (3)% (7)%
Total 11 % 16 % 13 %
Vehicle dollars:
Used vehicles 15 % 19 % 17 %
New vehicles (5)% (1)% (7)%
Total 13 % 16 % 12 %
Comparable store used unit sales growth is one of the key
drivers of our profitability. A CarMax store is included in
comparable store sales in the store’s fourteenth full month of
operation. Comparable store retail sales changes were as follows:
Years Ended February 28 or 29
2005 2004 2003
Vehicle units:
Used vehicles 1% 6 % 8 %
New vehicles 8% (1)% (3)%
Total 1% 5 % 6 %
Vehicle dollars:
Used vehicles 3% 7 % 8 %
New vehicles 8% 1 % (3)%
Total 3% 6 % 6 %
Used Vehicle Sales. The increases in used vehicle sales of 15%
in fiscal 2005 and 19% in fiscal 2004 primarily reflect the
opening of used car superstores not yet in our comparable store
base. We opened five used car superstores in fiscal 2003, nine in
fiscal 2004, and nine in fiscal 2005. During the first half of fiscal
2005, we experienced widespread volatility and softness in our
used car business during the peak spring and summer selling
season. We believe the soft market environment was the result of
economic and other factors such as high gas prices; the intense
competition and unpredictable incentive behavior among new
car manufacturers; higher wholesale vehicle prices resulting, in
part, from fewer off-lease vehicles; and severe weather in the
southeastern United States. In the second half of fiscal 2005,
used vehicle sales growth increased as many of the factors that
appeared to cause the first half weakness abated. We experienced
the strongest sales growth of the fiscal year in the fourth quarter,
reinforcing our belief that the softness experienced during the
first half of the year was due to external factors and was not
indicative of issues related to the execution of our consumer
offer, nor to the pressures of geographic expansion.
Following a nine-month test in selected stores, in August
2004 we added DRIVE Financial Services to our group of
third-party lenders. DRIVE provides subprime financing.
DRIVE-financed sales added approximately 3% to our total
used unit sales in fiscal 2005. We believe these were
incremental sales that we previously would not have been able
to finance. DRIVE-financed sales were highest in our fourth
fiscal quarter, coinciding with the income tax-refund season.
The fiscal 2004 used vehicle sales increase was due to the
growth in comparable store used unit sales that resulted from
strong sales execution and marketing programs, as well as the
return to historical levels of nonprime approval rates by third-
party lenders following the lower approval rates experienced
in the fourth quarter of fiscal 2003.
New Vehicle Sales. New vehicle sales were generally in line
with industry performance for the core brands we represent—
Chevrolet, DaimlerChrysler, Nissan, and Toyota. Declines in
total new car sales and units are due primarily to the disposition
of five new car franchises in fiscal 2005, four in fiscal 2004, and
one in fiscal 2003.
Wholesale Vehicle Sales. Our operating strategy is to build
customer satisfaction by offering high-quality vehicles. Fewer
than half of the vehicles acquired from consumers through the
appraisal purchase process meet our standards for
reconditioning and subsequent retail sale. Those vehicles that
do not meet our standards are sold at our on-site wholesale
auctions. Total wholesale vehicle units sold at these auctions
were 155,393 in fiscal 2005; 127,168 in fiscal 2004; and 104,593
in fiscal 2003.
In fiscal 2005, the increase in wholesale vehicle sales as a
percentage of total net sales and operating revenues was due in
large part to enhancements to the processes that our sales
consultants use to deliver appraisals to customers and our
systems support for buyers.We believe that these enhancements
have contributed to the continuing increase in our rate of
appraisal purchases completed per appraisal offers made.
Additionally, higher average wholesale prices added to the
wholesale vehicle sales increases. In fiscal 2004, the growth in
wholesale vehicle sales reflected in part an increase in wholesale
appraisal traffic resulting from increased consumer response to
our vehicle appraisal offer.
Other Sales and Revenues. Other sales and revenues include
extended service plan revenues, service department sales, third-
party finance fees, and, through the second quarter of fiscal
2004, appraisal purchase processing fees collected from
customers on the purchase of their vehicles.
During the second quarter of fiscal 2004, the appraisal
purchase processing fees were replaced with an alternative
method for recovering the costs of our appraisal and wholesale
operations. Under the revised appraisal cost recovery (“ACR”)
method, instead of charging the customer the appraisal purchase
processing fee, we adjust the price of our purchase offer to allow
for full recovery of our costs, thereby reducing the acquisition