CarMax 2005 Annual Report Download - page 15
Download and view the complete annual report
Please find page 15 of the 2005 CarMax annual report below. You can navigate through the pages in the report by either clicking on the pages listed below, or by using the keyword search tool below to find specific information within the annual report.-
 1
1 -
2
-
3
-
4
-
 5
5 -
 6
6 -
 7
7 -
 8
8 -
 9
9 -
 10
10 -
 11
11 -
 12
12 -
 13
13 -
 14
14 -
 15
15 -
 16
16 -
 17
17 -
 18
18 -
 19
19 -
 20
20 -
 21
21 -
 22
22 -
 23
23 -
 24
24 -
 25
25 -
26
-
27
-
28
-
29
-
30
-
31
-
32
-
33
-
34
-
35
-
36
-
37
-
38
-
39
-
40
-
41
-
42
-
43
-
44
-
45
-
46
-
47
-
48
-
49
-
50
-
51
-
52
 |
 |
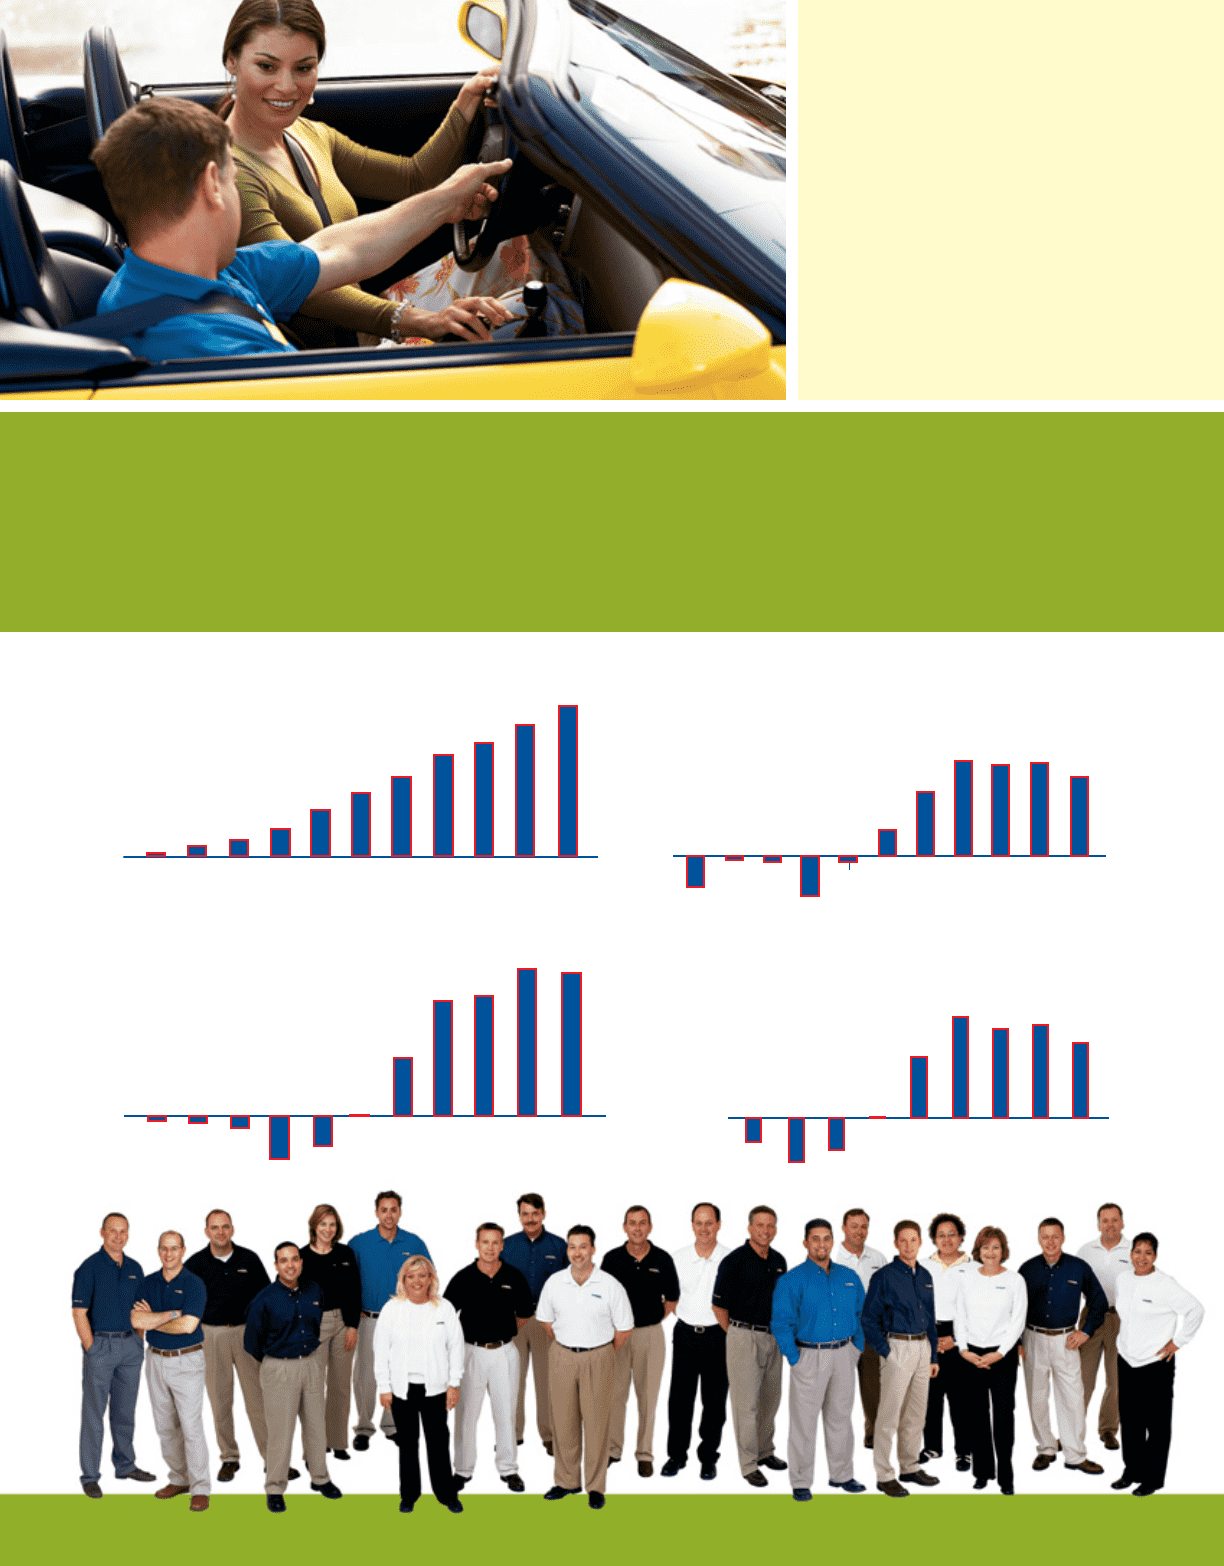
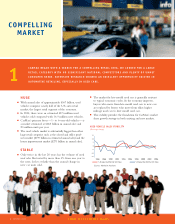
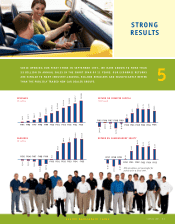
SINCE OPENING OUR FIRST STORE IN SEPTEMBER 1993, WE HAVE GROWN TO MORE THAN
$5 BILLION IN ANNUAL SALES IN THE SHORT SPAN OF 11 YEARS. OUR ECONOMIC RETURNS
ARE SIMILAR TO MANY INDUSTRY-LEADING, BIG-BOX RETAILERS AND SIGNIFICANTLY BETTER
THAN THE PUBLICLY TRADED NEW CAR DEALER GROUPS. 5
CARMAX 2005
13
REGION MANAGEMENT TEAMS
STRONG
RESULTS
EARNINGS
(In millions)
REVENUES
(In millions)
RETURN ON INVESTED CAPITAL
(Unleveraged)
RETURN ON SHAREHOLDERS’ EQUITY
$93.5
$327.1
$566.7
$950.7
$1,607.3
$2,201.2
$2,758.5
$3,533.8
$3,969.9
$4,597.7
$5,260.3
FY05FY04FY03FY02
FY01FY00FY99FY98FY97FY96FY95
$(4.1)
$(5.2)
$(9.3)
$(34.2)
$(23.5)
$1.1
$45.6
$90.8
$94.8
$116.5
$112.9
FY
05
FY
04
FY
03
FY
02
FY
01
FY
00
FY
99
FY
98
FY
97
FY
96
FY
95
(4.1)%
(0.5)%
(0.8)%
(5.3)%
(0.8)%
3.5%
8.5%
12.7%
12.1%
12.4%
10.8%
FY
05
FY
04
FY
03
FY
02
FY
01
FY
00
FY
99
FY
98
FY
97
FY
96
FY
95
FY
05
FY
04
FY
03
FY
02
FY
01
FY
00
FY
99
FY
98
FY
97
18.9%
15.2%
18.2%
20.7%
12.4%
0.3%
(6.7)%
(9.1)%
(4.9)%
ROE calculations not meaningful for
periods prior to fiscal 1997.