CarMax 2005 Annual Report Download - page 25
Download and view the complete annual report
Please find page 25 of the 2005 CarMax annual report below. You can navigate through the pages in the report by either clicking on the pages listed below, or by using the keyword search tool below to find specific information within the annual report.-
 1
1 -
2
-
3
-
4
-
5
-
6
-
7
-
8
-
9
-
10
-
11
-
12
-
13
-
14
-
 15
15 -
 16
16 -
 17
17 -
 18
18 -
 19
19 -
 20
20 -
 21
21 -
 22
22 -
 23
23 -
 24
24 -
 25
25 -
 26
26 -
 27
27 -
 28
28 -
 29
29 -
 30
30 -
 31
31 -
 32
32 -
 33
33 -
 34
34 -
 35
35 -
36
-
37
-
38
-
39
-
40
-
41
-
42
-
43
-
44
-
45
-
46
-
47
-
48
-
49
-
50
-
51
-
52
 |
 |

CARMAX 2005
23
CAF originates automobile loans to CarMax customers at
competitive market rates of interest. The majority of the profit
contribution from CAF is generated by the spread between
the interest rates charged to customers and our cost of funds.
Substantially all of the loans originated by CAF each month are
sold in securitization transactions as described in Note 4 to the
company’s consolidated financial statements. A gain, recorded at
the time of the securitization transaction, results from recording
a receivable approximately equal to the present value of the
expected residual cash flows generated by the securitized
receivables. The cash flows are calculated taking into account
expected prepayment and default rates.
CarMax Auto Finance income declined 3% to $82.7 million
in fiscal 2005, reflecting the decline in the gain spread to 3.8%
in fiscal 2005 from 4.7% in fiscal 2004. As anticipated, this
decrease in CAF income resulted primarily from a return to
more normal gain spread levels, as CAF’s cost of funds increased
more rapidly than consumer loan rates during the fiscal year. In
fiscal 2004, CarMax Auto Finance income increased 3% to
$85.0 million from $82.4 million in fiscal 2003, while the gain
spread decreased to 4.7% from 5.8% in fiscal 2003. The increase
in total CAF income was attributed to an increase in other CAF
income, partially offset by gain spreads returning to more
normalized levels during the second half of fiscal 2004. During
fiscal 2003 and the first half of fiscal 2004, we benefited from
higher-than-normal gain spreads resulting from consumer loan
rates falling more slowly than our cost of funds. The increases in
total other CAF income and total direct CAF expenses were
proportionate to the increase in the managed receivables for all
fiscal years presented.
CAF’s fiscal 2005 gains on sales of loans include favorable
impacts from both the May 2004 repurchase and subsequent
sale into the warehouse facility of the remaining receivables
related to the 2001–1 securitization, and the November 2004
adjustment in the valuation of the retained interest in
securitized receivables. Excluding the impact of both of these
items, the fiscal 2005 gain as a percent of loans sold was 3.7%.
We exercised our option to repurchase the receivables
outstanding in the 2001–1 securitization when the remaining
balance of the receivables fell below 10% of the original pool
balance. These loan balances carried relatively high interest
rates that, combined with a relatively low short-term funding
cost, resulted in an earnings benefit of approximately $0.01
per share.
The favorable adjustment in the valuation of the retained
interest reflected lower loss assumptions on certain newer pools
of securitized receivables, contributing approximately $0.01 to
earnings per share. We believe that the lower loss rates were the
result of a combination of factors, including improved general
economic conditions, the implementation of a new credit
scorecard in the third quarter of fiscal 2003, and operational
efficiencies resulting from systems enhancements.
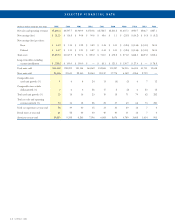
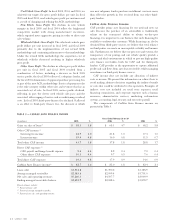
We are at risk for the performance of the managed securitized
receivables to the extent that we maintain a retained interest in
the receivables. Supplemental information on the portfolio of
managed receivables is as follows:
As of February 28 or 29
(In millions) 2005 2004 2003
Loans securitized $2,427.2 $2,200.4 $1,859.1
Loans held for sale
or investment 67.7 48.2 19.6
Ending managed receivables $2,494.9 $2,248.6 $1,878.7
Accounts 31+ days past due $ 31.1 $ 31.4 $ 27.6
Past due accounts as a
percentage of ending
managed receivables 1.24% 1.40% 1.47%
Years Ended February 28 or 29
(In millions) 2005 2004 2003
Average managed
receivables $2,383.6 $2,099.4 $1,701.0
Credit losses on managed
receivables $ 19.5 $ 21.1 $ 17.5
Credit losses as a
percentage of average
managed receivables 0.82% 1.01% 1.03%
We believe the decrease in credit losses as a percentage of
average managed receivables in fiscal 2005 was due to a
combination of factors, including improved general economic
conditions, the implementation of a new credit scorecard in
the third quarter of fiscal 2003, and operational efficiencies
resulting from system enhancements. The recovery rate was
46% in fiscal 2005, 42% in fiscal 2004, and 43% fiscal 2003. The
recovery rate represents the average percentage of the
outstanding principal balance CarMax receives when a vehicle
is repossessed and liquidated.
If the managed receivables do not perform in accordance
with the assumptions used in determining the fair value of the
retained interest, earnings could be impacted. As previously
discussed, in November 2004, we lowered our cumulative loss
assumptions for certain newer pools of receivables, resulting in a
favorable adjustment in the valuation of the retained interest and
contributing approximately $0.01 to earnings per share. In fiscal
2004, we increased the cumulative loss assumptions for certain
pools of older receivables and new originations. These changes
had no material impact on fiscal 2004 earnings or the fair value
of the retained interest.