CarMax 2005 Annual Report Download - page 23
Download and view the complete annual report
Please find page 23 of the 2005 CarMax annual report below. You can navigate through the pages in the report by either clicking on the pages listed below, or by using the keyword search tool below to find specific information within the annual report.-
 1
1 -
2
-
3
-
4
-
5
-
6
-
7
-
8
-
9
-
10
-
11
-
12
-
 13
13 -
 14
14 -
 15
15 -
 16
16 -
 17
17 -
 18
18 -
 19
19 -
 20
20 -
 21
21 -
 22
22 -
 23
23 -
 24
24 -
 25
25 -
 26
26 -
 27
27 -
 28
28 -
 29
29 -
 30
30 -
 31
31 -
 32
32 -
 33
33 -
34
-
35
-
36
-
37
-
38
-
39
-
40
-
41
-
42
-
43
-
44
-
45
-
46
-
47
-
48
-
49
-
50
-
51
-
52
 |
 |

CARMAX 2005
21
costs of used and wholesale vehicles and increasing used vehicle
and wholesale vehicle gross profit margins. The intent of the
revised ACR method is to recover all costs,including the related
costs of land where we hold vehicles before their sale at the
wholesale auctions.
Overall, other sales and revenues growth is attributed to
increases in extended service plan revenues, service department
sales, and third-party nonprime finance fees. In fiscal 2005, the
cost of providing subprime financing offset some of these
increases. As is customary in the industry, subprime finance
contracts are purchased from the company at a discount. We
record this discount as an offset to third-party finance fees.
Impact of Inflation. Inflation has not been a significant
contributor to results. Profitability is based on achieving targeted
unit sales and gross profit dollars per vehicle rather than on
average retail prices.
Seasonality. Most of our superstores experience their
strongest sales in the spring and summer fiscal quarters.
Supplemental Sales Information.
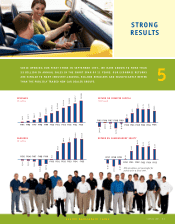
RETAIL UNIT SALES
Years Ended February 28 or 29
2005 2004 2003
Used vehicles 253,168 224,099 190,135
New vehicles 20,636 21,641 22,360
Total 273,804 245,740 212,495
AVERAGE RETAIL SELLING PRICES
Years Ended February 28 or 29
2005 2004 2003
Used vehicles $15,663 $15,379 $15,243
New vehicles $23,671 $23,650 $23,183
Total vehicles $16,267 $16,107 $16,078
RETAIL VEHICLE SALES MIX
Years Ended February 28 or 29
2005 2004 2003
Vehicle units:
Used vehicles 92% 91% 89%
New vehicles 8911
Total 100% 100% 100%
Vehicle dollars:
Used vehicles 89% 87% 85%
New vehicles 11 13 15
Total 100% 100% 100%
RETAIL STORES
As of February 28 or 29
2005 2004 2003
Mega superstores (1) 13 13 13
Standard superstores (2) 29 24 19
Satellite superstores (3) 16 12 8
Co-located new car stores 332
Standalone new car stores ——2
Total 61 52 44
(1) 70,000 to 95,000 square feet on 20 to 35 acres.
(2) 40,000 to 60,000 square feet on 10 to 25 acres.
(3) 10,000 to 20,000 square feet on 4 to 7 acres.
NEW CAR FRANCHISES
As of February 28 or 29
2005 2004 2003
Integrated/co-located
new car franchises 712 15
Standalone new car franchises ——2
Total 712 17
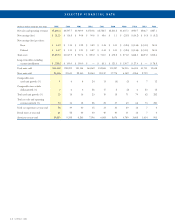
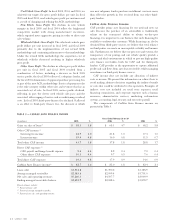
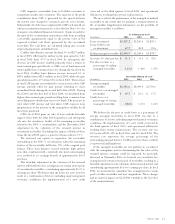
Gross Profit
The components of gross profit margins and gross profit per
unit are presented in Table 2.
TABLE 2 — GROSS PROFIT
Years Ended February 28 or 29
2005 2004 2003
$ per unit(1) %(2) $ per unit(1) %(2) $ per unit(1) %(2)
Used vehicle gross profit $1,817 11.5 $1,742 11.3 $1,648 10.8
New vehicle gross profit 860 3.6 872 3.7 931 4.0
Wholesale vehicle gross profit 464 12.2 359 10.4 192 5.5
Other gross profit 366 55.3 472 67.7 534 66.5
Total gross profit $2,375 12.4 $2,323 12.4 $2,201 11.8
(1) Calculated as category gross profit divided by its respective units sold, except the other and total categories, which are divided by total retail units sold.
(2) Calculated as a percentage of its respective sales or revenue.