CarMax 2005 Annual Report Download - page 32
Download and view the complete annual report
Please find page 32 of the 2005 CarMax annual report below. You can navigate through the pages in the report by either clicking on the pages listed below, or by using the keyword search tool below to find specific information within the annual report.-
 1
1 -
2
-
3
-
4
-
5
-
6
-
7
-
8
-
9
-
10
-
11
-
12
-
13
-
14
-
15
-
16
-
17
-
18
-
19
-
20
-
21
-
 22
22 -
 23
23 -
 24
24 -
 25
25 -
 26
26 -
 27
27 -
 28
28 -
 29
29 -
 30
30 -
 31
31 -
 32
32 -
 33
33 -
 34
34 -
 35
35 -
 36
36 -
 37
37 -
 38
38 -
 39
39 -
 40
40 -
 41
41 -
 42
42 -
43
-
44
-
45
-
46
-
47
-
48
-
49
-
50
-
51
-
52
 |
 |

30
CARMAX 2005
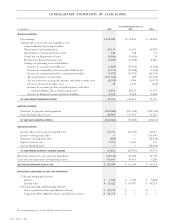
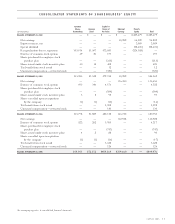
CONSOLIDATED STATEMENTS OF CASH FLOWS
Years Ended February 28 or 29
(In thousands)
2005 2004 2003
OPERATING ACTIVITIES:
Net earnings $ 112,928 $ 116,450 $ 94,802
Adjustments to reconcile net earnings to net
cash provided by operating activities:
Depreciation and amortization 20,145 16,181 14,873
Amortization of restricted stock awards 108 122 77
(Gain) loss on disposition of assets (1,486) (1,462) 30
Provision for deferred income taxes (1,184) (1,298) 8,880
Changes in operating assets and liabilities:
Increase in accounts receivable, net (3,809) (15,909) (6,008)
Increase in automobile loan receivables held for sale (3,371) (15,202) (1,435)
Increase in retained interest in securitized receivables (1,975) (10,972) (14,333)
(Increase) decrease in inventory (110,506) 389 (67,366)
(Increase) decrease in prepaid expenses and other current assets (4,358) 3,986 (10,571)
Decrease (increase) in other assets 42 4,647 (845)
Increase in accounts payable, accrued expenses and other
current liabilities and accrued income taxes 35,876 48,570 51,375
Increase in deferred revenue and other liabilities 2,326 2,962 2,488
NET CASH PROVIDED BY OPERATING ACTIVITIES
44,736 148,464 71,967
INVESTING ACTIVITIES:
Purchases of property and equipment (230,080) (181,338) (122,032)
Proceeds from sales of assets 88,999 107,493 41,621
NET CASH USED IN INVESTING ACTIVITIES
(141,081) (73,845) (80,411)
FINANCING ACTIVITIES:
Increase (decrease) in short-term debt, net 60,751 (51,605) 46,211
Issuance of long-term debt —— 100,000
Payments on long-term debt (509) — (78,608)
Equity issuances, net 3,559 4,014 570
Special dividend paid —— (28,400)
NET CASH PROVIDED BY (USED IN) FINANCING ACTIVITIES
63,801 (47,591) 39,773
(Decrease) increase in cash and cash equivalents (32,544) 27,028 31,329
Cash and cash equivalents at beginning of year 61,643 34,615 3,286
CASH AND CASH EQUIVALENTS AT END OF YEAR
$ 29,099 $ 61,643 $ 34,615
SUPPLEMENTAL DISCLOSURES OF CASH FLOW INFORMATION
Cash paid during the year for:
Interest $ 5,726 $ 4,695 $ 3,862
Income taxes $ 72,022 $ 59,987 $ 49,215
Noncash investing and financing activities:
Asset acquisitions from capitalization of leases $ 29,258 $— $—
Long-term debt obligations from capitalization of leases $ 29,258 $— $—
See accompanying notes to consolidated financial statements.