CarMax 2005 Annual Report Download - page 38
Download and view the complete annual report
Please find page 38 of the 2005 CarMax annual report below. You can navigate through the pages in the report by either clicking on the pages listed below, or by using the keyword search tool below to find specific information within the annual report.-
 1
1 -
2
-
3
-
4
-
5
-
6
-
7
-
8
-
9
-
10
-
11
-
12
-
13
-
14
-
15
-
16
-
17
-
18
-
19
-
20
-
21
-
22
-
23
-
24
-
25
-
26
-
27
-
 28
28 -
 29
29 -
 30
30 -
 31
31 -
 32
32 -
 33
33 -
 34
34 -
 35
35 -
 36
36 -
 37
37 -
 38
38 -
 39
39 -
 40
40 -
 41
41 -
 42
42 -
 43
43 -
 44
44 -
 45
45 -
 46
46 -
 47
47 -
 48
48 -
49
-
50
-
51
-
52
 |
 |

36
CARMAX 2005
Required Excess Receivables. The warehouse facility and
certain public securitizations require that the total value of the
securitized receivables exceed, by a specified amount, the
principal amount owed to the investors. The required excess
receivables balance represents this specified amount. Any cash
flows generated by the required excess receivables are used, if
needed, to make payments to the investors. The unpaid
principal balance related to the required excess receivables was
$44.3 million as of February 28, 2005, and $28.8 million as of
February 29, 2004.
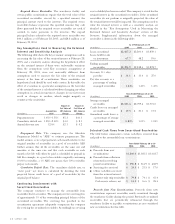
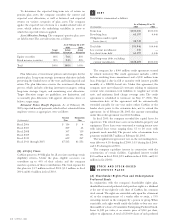
Key Assumptions Used in Measuring the Retained
Interest and Sensitivity Analysis
The following table shows the key economic assumptions used in
measuring the fair value of the retained interest at February 28,
2005, and a sensitivity analysis showing the hypothetical effect
on the retained interest if there were unfavorable variations
from the assumptions used. Key economic assumptions at
February 28, 2005, were not materially different from
assumptions used to measure the fair value of the retained
interest at the time of securitization. These sensitivities are
hypothetical and should be used with caution. In this table, the
effect of a variation in a particular assumption on the fair value
of the retained interest is calculated without changing any other
assumption; in actual circumstances, changes in one factor may
result in changes in another, which might magnify or
counteract the sensitivities.
Impact on Impact on
Fair Value of Fair Value of
Assumptions 10% Adverse 20% Adverse
(In millions) Used Change Change
Prepayment rate 1.45%–1.55% $5.3 $10.3
Cumulative default rate 1.85%–2.50% $4.0 $ 8.1
Annual discount rate 12.0% $2.1 $ 4.2
Prepayment Rate. The company uses the Absolute
Prepayment Model or “ABS” to estimate prepayments. This
model assumes a rate of prepayment each month relative to the
original number of receivables in a pool of receivables. ABS
further assumes that all the receivables are the same size and
amortize at the same rate and that each receivable in each
month of its life will either be paid as scheduled or prepaid in
full. For example, in a pool of receivables originally containing
10,000 receivables, a 1% ABS rate means that 100 receivables
prepay each month.
Cumulative Default Rate. The cumulative default rate, or
“static pool” net losses, is calculated by dividing the total
projected future credit losses of a pool of receivables by the
original pool balance.
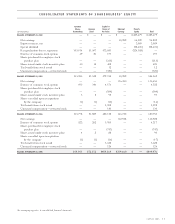
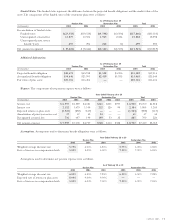
Continuing Involvement with
Securitized Receivables
The company continues to manage the automobile loan
receivables that it securitizes. The company receives servicing fees
of approximately 1% of the outstanding principal balance of the
securitized receivables. The servicing fees specified in the
securitization agreements adequately compensate the company
for servicing the securitized receivables. Accordingly, no servicing
asset or liability has been recorded. The company is at risk for the
retained interest in the securitized receivables. If the securitized
receivables do not perform as originally projected, the value of
the retained interest would be impacted. The assumptions used to
value the retained interest, as well as a sensitivity analysis, are
detailed in the “Key Assumptions Used in Measuring the
Retained Interest and Sensitivity Analysis” section of this
footnote. Supplemental information about the managed
receivables is shown in the following tables:
As of February 28 or 29
(In millions) 2005 2004 2003
Loans securitized $2,427.2 $2,200.4 $1,859.1
Loans held for sale
or investment 67.7 48.2 19.6
Ending managed
receivables $2,494.9 $2,248.6 $1,878.7
Accounts 31+ days
past due $ 31.1 $ 31.4 $ 27.6
Past due accounts as a
percentage of ending
managed receivables 1.24% 1.40% 1.47%
Years Ended February 28 or 29
(In millions) 2005 2004 2003
Average managed
receivables $2,383.6 $2,099.4 $1,701.0
Credit losses on managed
receivables $ 19.5 $ 21.1 $ 17.5
Annualized credit losses as
a percentage of average
managed receivables 0.82% 1.01% 1.03%
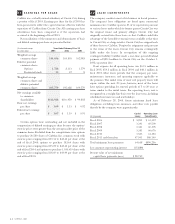
Selected Cash Flows from Securitized Receivables
The table below summarizes certain cash flows received from
and paid to the automobile loan securitizations:
Years Ended February 28 or 29
(In millions) 2005 2004 2003
3Proceeds from new
securitizations $1,260.0 $1,185.5 $1,018.7
3Proceeds from collections
reinvested in revolving
period securitizations $ 590.8 $ 514.9 $ 468.9
3Servicing fees received $ 24.5 $ 21.5 $ 17.0
3Other cash flows received
from the retained interest:
Interest-only strip receivables $ 79.8 $ 74.1 $ 65.4
Cash reserve releases, net $ 14.1 $ 16.6 $ 25.3
Proceeds from New Securitizations. Proceeds from new
securitizations represent receivables newly securitized through
the warehouse facility during the period. Previously securitized
receivables that are periodically refinanced through the
warehouse facility or in public securitizations are not considered
new securitizations for this table.