CarMax 2005 Annual Report Download - page 40
Download and view the complete annual report
Please find page 40 of the 2005 CarMax annual report below. You can navigate through the pages in the report by either clicking on the pages listed below, or by using the keyword search tool below to find specific information within the annual report.-
 1
1 -
2
-
3
-
4
-
5
-
6
-
7
-
8
-
9
-
10
-
11
-
12
-
13
-
14
-
15
-
16
-
17
-
18
-
19
-
20
-
21
-
22
-
23
-
24
-
25
-
26
-
27
-
28
-
29
-
 30
30 -
 31
31 -
 32
32 -
 33
33 -
 34
34 -
 35
35 -
 36
36 -
 37
37 -
 38
38 -
 39
39 -
 40
40 -
 41
41 -
 42
42 -
 43
43 -
 44
44 -
 45
45 -
 46
46 -
 47
47 -
 48
48 -
 49
49 -
 50
50 -
51
-
52
 |
 |

38
CARMAX 2005
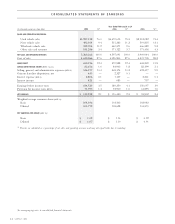
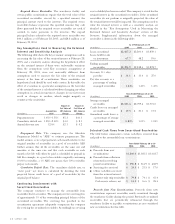
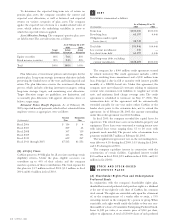
The effective income tax rate differed from the federal
statutory income tax rate as follows:
Years Ended February 28 or 29
2005 2004 2003
Federal statutory
income tax rate 35.0% 35.0% 35.0%
State and local income taxes,
net of federal benefit 3.5 3.1 3.0
Nondeductible items 0.3 0.4 1.5
Effective income tax rate 38.8% 38.5% 39.5%
The tax effects of temporary differences that give rise to a
significant portion of the deferred tax assets and liabilities were
as follows:
As of February 28 or 29
(In thousands) 2005 2004
Deferred tax assets:
Accrued expenses $12,381 $ 9,048
Other 100 79
Total gross deferred tax assets 12,481 9,127
Deferred tax liabilities:
Securitized receivables 23,301 27,940
Inventory 8,515 7,607
Depreciation and amortization 7,744 5,224
Investment basis 4,106 —
Prepaid expenses 157 882
Total gross deferred tax liabilities 43,823 41,653
Net deferred tax liability $31,342 $32,526
Based on the company’s historical and current pretax
earnings, management believes the amount of gross deferred tax
assets will more likely than not be realized through future
taxable income and future reversals of existing temporary
differences; therefore, no valuation allowance is necessary.
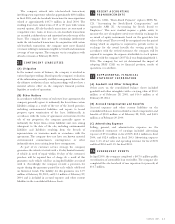
BENEFIT PLANS
(A) Retirement Plans
The company has a noncontributory defined benefit pension
plan (the “pension plan”) covering the majority of full-time
employees who are at least 21 years old and have completed one
year of service. The cost of the program is being funded
currently. Plan benefits generally are based on years of service and
average compensation. The company also has an unfunded
nonqualified plan (the “restoration plan”) that restores retirement
benefits for certain senior executives who are affected by Internal
Revenue Code limitations on benefits provided under the
pension plan. The liabilities for these plans are included in
accrued expenses and other current liabilities in the consolidated
balance sheets.The company uses a fiscal year end measurement
date for both the pension plan and the restoration plan.
Funding Policy. For the defined benefit pension plan, the
company contributes amounts sufficient to meet minimum
funding requirements as set forth in the employee benefit and tax
laws plus any additional amounts as the company may determine
to be appropriate. The company expects to contribute at least
$4.0 million to the pension plan in fiscal 2006.
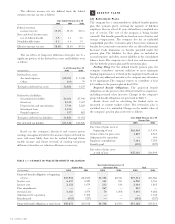
Projected Benefit Obligations. The projected benefit
obligations are the present value of future benefits to employees,
including assumed salary increases. Changes in the company’s
projected benefit obligations are presented in Table 1.
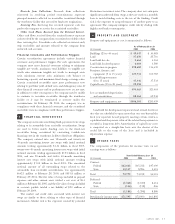
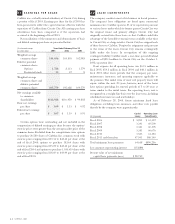
Assets. Assets used in calculating the funded status are
measured at current market values. The restoration plan is
excluded since it is unfunded. Changes in the market value of
the company’s pension plan assets were as follows:
Years Ended February 28 or 29
Pension Plan
(In thousands) 2005 2004
Fair value of plan assets at
beginning of year $16,404 $ 5,676
Actual return on plan assets 1,849 2,564
Adjustment for separation —606
Employer contributions 7,381 7,785
Benefits paid (318) (227)
Fair value of plan assets
at end of year $25,316 $16,404
8
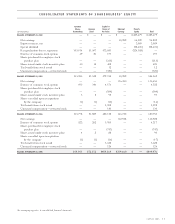
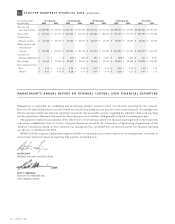
TABLE 1 — CHANGES IN PROJECTED BENEFIT OBLIGATION
Years Ended February 28 or 29
Pension Plan Restoration Plan Total
(In thousands) 2005 2004 2005 2004 2005 2004
Projected benefit obligation at beginning
of year $35,918 $24,555 $3,596 $2,031 $39,514 $26,586
Service cost 6,557 5,529 343 231 6,900 5,760
Interest cost 2,152 1,679 232 126 2,384 1,805
Plan amendments ——267 —267 —
Actuarial loss 4,365 3,074 70 1,208 4,435 4,282
Adjustment for separation —1,308 ———1,308
Benefits paid (318) (227) ——(318) (227)
Projected benefit obligation at end of year $48,674 $35,918 $4,508 $3,596 $53,182 $39,514