CarMax 2005 Annual Report Download - page 3
Download and view the complete annual report
Please find page 3 of the 2005 CarMax annual report below. You can navigate through the pages in the report by either clicking on the pages listed below, or by using the keyword search tool below to find specific information within the annual report.-
 1
1 -
 2
2 -
 3
3 -
 4
4 -
 5
5 -
 6
6 -
 7
7 -
 8
8 -
 9
9 -
 10
10 -
 11
11 -
 12
12 -
 13
13 -
 14
14 -
15
-
16
-
17
-
18
-
19
-
20
-
21
-
22
-
23
-
24
-
25
-
26
-
27
-
28
-
29
-
30
-
31
-
32
-
33
-
34
-
35
-
36
-
37
-
38
-
39
-
40
-
41
-
42
-
43
-
44
-
45
-
46
-
47
-
48
-
49
-
50
-
51
-
52
 |
 |
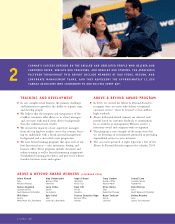
STORE MANAGEMENT TEAMS
(Dollars in millions except per share data)
PERCENT CHANGE FISCAL YEARS ENDED FEBRUARY 28 OR 29
‘04 TO ‘05 2005 2004 2003* 2002* 2001
OPERATING RESULTS
Net sales and operating revenues 14 % $5,260.3 $4,597.7 $3,969.9 $3,533.8 $2,758.5
Net earnings (3)% $ 112.9 $ 116.5 $ 94.8 $ 90.8 $ 45.6
Separation costs* nm $— $ — $ 7.8 $ 0.4 $ —
Net earnings excluding separation costs (3)% $ 112.9 $ 116.5 $ 102.6 $ 91.2 $ 45.6
PER SHARE DATA
Diluted earnings (3)% $ 1.07 $ 1.10 $ 0.91 $ 0.87 $ 0.44
Separation costs* nm $— $ — $ 0.07 $ 0.01 $ —
Diluted earnings excluding separation costs (3)% $ 1.07 $ 1.10 $ 0.98 $ 0.88 $ 0.44
OTHER INFORMATION
Cash provided by operating activities (70)% $ 44.7 $ 148.5 $ 72.0 $ 42.6 $ 18.0
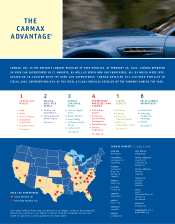
Used car superstores, at year-end 18 % 58 49 40 35 33
* Results for fiscal 2003 and fiscal 2002 include costs related to the October 2002 separation of CarMax from Circuit City Stores, Inc.
nm = not meaningful
Forward-Looking Statements: Statements in this annual report about the company’s future business plans, operations, opportunities, or prospects, including without limitation any
statements or factors regarding expected sales, margins, or earnings, are forward-looking statements made pursuant to the safe harbor provisions of the Private Securities Reform Act of
1995. Such forward-looking statements are based on management’s current knowledge and assumptions about future events and involve risks and uncertainties that could cause actual
results to differ materially from anticipated results. For more details on factors that could affect expectations, see “Management’s Discussion and Analysis of Financial Condition and
Results of Operations” contained in this annual report and the reports that the company files with or furnishes to the Securities and Exchange Commission.
Separation: On October 1, 2002, CarMax, Inc. was separated from Circuit City Stores, Inc. and became an independent, separately traded public company. Details of the separation are
discussed in the company’s Annual Report on Form 10-K for the fiscal year ended February 28, 2005. The consolidated financial statements and related information contained in this
annual report are presented as if CarMax existed as a separate entity during all periods presented.
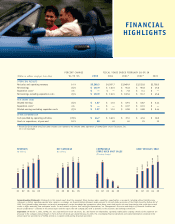
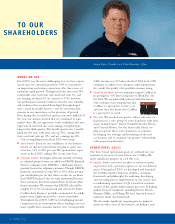
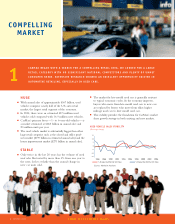
REVENUES
(In billions)
COMPARABLE
STORE USED UNIT SALES
(Percentage change)
NET EARNINGS
(In millions)
USED VEHICLES SOLD
FINANCIAL
HIGHLIGHTS
1
13
24
8
6
$5.26
$2.76
$3.53
$3.97
$4.60
$112.9
$45.6
$90.8
$94.8
$116.5
0504030201 0504030201 0504030201 0504030201
224,099
253,168
132,868
164,062
190,135