CarMax 2005 Annual Report Download - page 36
Download and view the complete annual report
Please find page 36 of the 2005 CarMax annual report below. You can navigate through the pages in the report by either clicking on the pages listed below, or by using the keyword search tool below to find specific information within the annual report.-
 1
1 -
2
-
3
-
4
-
5
-
6
-
7
-
8
-
9
-
10
-
11
-
12
-
13
-
14
-
15
-
16
-
17
-
18
-
19
-
20
-
21
-
22
-
23
-
24
-
25
-
 26
26 -
 27
27 -
 28
28 -
 29
29 -
 30
30 -
 31
31 -
 32
32 -
 33
33 -
 34
34 -
 35
35 -
 36
36 -
 37
37 -
 38
38 -
 39
39 -
 40
40 -
 41
41 -
 42
42 -
 43
43 -
 44
44 -
 45
45 -
 46
46 -
47
-
48
-
49
-
50
-
51
-
52
 |
 |

34
CARMAX 2005
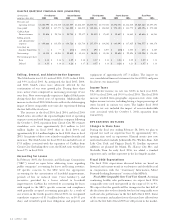
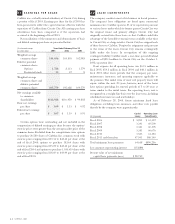
applied to all outstanding stock awards in each reported period
as follows:
Years Ended February 28 or 29
(In thousands except per share data) 2005 2004 2003
Net earnings, as reported $112,928 $116,450 $94,802
Total additional stock-based
compensation expenses
determined under the
fair-value-based method
for all awards, net of
related tax effects 11,501 6,759 4,391
Pro forma net earnings $101,427 $109,691 $90,411
Earnings per share:
Basic, as reported $ 1.09 $ 1.13 $ 0.92
Basic, pro forma $ 0.97 $ 1.06 $ 0.88
Diluted, as reported $ 1.07 $ 1.10 $ 0.91
Diluted, pro forma $ 0.97 $ 1.04 $ 0.86
The pro forma effect on fiscal 2005 and prior fiscal years
may not be representative of the pro forma effects on net
earnings and earnings per share for future years.
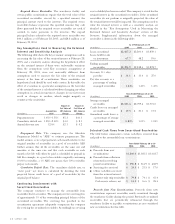
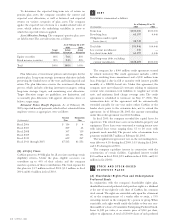
For the purpose of computing the pro forma amounts
indicated above, the fair value of each option on the date of
grant was estimated using the Black-Scholes option-pricing
model. The weighted average assumptions used in the model
were as follows:
Years Ended February 28 or 29
2005 2004 2003
Expected dividend yield ———
Expected stock volatility 73% 78% 76%
Risk-free interest rates 3% 3% 4%
Expected lives (in years) 555
Using these assumptions in the Black-Scholes model, the
weighted average fair value of options granted was $18 per
share in fiscal 2005, $9 per share in fiscal 2004, and $17 per share
in fiscal 2003.
(S) Derivative Financial Instruments
In connection with securitization activities through the
warehouse facility, the company enters into interest rate swap
agreements to manage exposure to interest rates and to more
closely match funding costs to the use of funding. The company
recognizes the interest rate swaps as either assets or liabilities on
the consolidated balance sheets at fair value with changes in fair
value included in earnings as a component of CarMax Auto
Finance income.
(T) Risks and Uncertainties
CarMax retails used and new vehicles. The diversity of the
company’s customers and suppliers reduces the risk that a severe
impact will occur in the near term as a result of changes in its
customer base, competition, or sources of supply. However,
management cannot assure that unanticipated events will not
have a negative impact on the company.
The preparation of financial statements in conformity with
accounting principles generally accepted in the United States of
America requires management to make estimates and
assumptions that affect the reported amounts of assets, liabilities,
revenues and expenses, and the disclosure of contingent assets
and liabilities. Actual results could differ from those estimates.
(U) Reclassifications
Certain prior year amounts have been reclassified to conform to
the current year’s presentation.
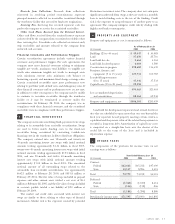
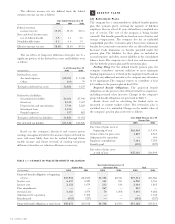
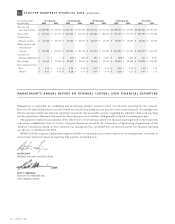
CARMAX AUTO FINANCE INCOME
The company’s finance operation, CAF, originates prime-rated
financing for qualified customers at competitive market rates of
interest.Throughout each month, the company sells substantially
all of the loans originated by CAF in securitization transactions as
discussed in Note 4. The majority of the contribution from CAF
is generated by the spread between the interest rate charged to
the customer and the company’s cost of funds. A gain,recorded at
the time of the securitization transaction, results from recording a
receivable approximately equal to the present value of the
expected residual cash flows generated by the securitized
receivables. The cash flows are calculated taking into account
expected prepayment and default rates.
CarMax Auto Finance income was as follows:
Years Ended February 28 or 29
(In millions) 2005 2004 2003
Gains on sales of loans $58.3 $65.1 $68.2
Other CAF income:
Servicing fee income 24.7 21.8 17.3
Interest income 19.0 16.0 11.5
Total other CAF income 43.7 37.8 28.8
Direct CAF expenses:
CAF payroll and
fringe benefit expense 9.0 8.2 7.0
Other direct CAF expenses 10.3 9.7 7.6
Total direct CAF expenses 19.3 17.9 14.6
CarMax Auto Finance income $82.7 $85.0 $82.4
CarMax Auto Finance income does not include any
allocation of indirect costs or income. The company presents
this information on a direct basis to avoid making arbitrary
decisions regarding the indirect benefit or costs that could be
attributed to CAF. Examples of indirect costs not included are
retail store expenses, retail financing commissions, and
corporate expenses such as human resources, administrative
services, marketing, information systems, accounting, legal,
treasury, and executive payroll.
3