CarMax 2005 Annual Report Download - page 24
Download and view the complete annual report
Please find page 24 of the 2005 CarMax annual report below. You can navigate through the pages in the report by either clicking on the pages listed below, or by using the keyword search tool below to find specific information within the annual report.-
 1
1 -
2
-
3
-
4
-
5
-
6
-
7
-
8
-
9
-
10
-
11
-
12
-
13
-
 14
14 -
 15
15 -
 16
16 -
 17
17 -
 18
18 -
 19
19 -
 20
20 -
 21
21 -
 22
22 -
 23
23 -
 24
24 -
 25
25 -
 26
26 -
 27
27 -
 28
28 -
 29
29 -
 30
30 -
 31
31 -
 32
32 -
 33
33 -
 34
34 -
35
-
36
-
37
-
38
-
39
-
40
-
41
-
42
-
43
-
44
-
45
-
46
-
47
-
48
-
49
-
50
-
51
-
52
 |
 |

22
CARMAX 2005
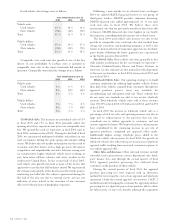
Used Vehicle Gross Profit. In fiscal 2005, 2004, and 2003, we
achieved our targets for gross profit dollars per unit. In fiscal
2005 and fiscal 2004, used vehicle gross profit per unit increased
as a result of changing and refining the ACR methodology.
New Vehicle Gross Profit. The declines in new vehicle
margins in fiscal 2005 and fiscal 2004 reflect the heightened
competitive market with strong manufacturers’ incentives,
which required more aggressive pricing in order to drive unit
sales volume.
Wholesale Vehicle Gross Profit. The wholesale vehicle gross
profit dollars per unit increased in fiscal 2005 and fiscal 2004
primarily due to the implementation of our revised ACR
methodology and continuing refinements to that methodology.
Under the revised ACR methodology, the acquisition cost of
wholesale vehicles decreased resulting in higher wholesale
gross profit.
Other Gross Profit. The decline in other gross profit dollars
per unit in fiscal 2005 and fiscal 2004 resulted from a
combination of factors, including a decrease in fiscal 2005
service profits, the fiscal 2005 rollout of a subprime lender, and
the fiscal 2004 elimination of appraisal purchase processing fees
as part of the new ACR methodology. Service department sales
is the only category within other sales and revenues that has an
associated cost of sales. In fiscal 2005, service profits declined,
reflecting, in part, the slower used vehicle sales pace and the
associated deleveraging of service and reconditioning overhead
costs. In fiscal 2005, third-party finance fees declined. Reflected
as an offset to third-party finance fees, the discount at which
our new subprime lender purchases installment contracts more
than offset the growth in fees received from our other third-
party lenders.
CarMax Auto Finance Income
CAF provides prime auto financing for our used and new car
sales. Because the purchase of an automobile is traditionally
reliant on the consumer’s ability to obtain on-the-spot
financing, it is important to our business that such financing be
available to creditworthy customers. While financing can also be
obtained from third-party sources, we believe that total reliance
on third parties can create an unacceptable volatility and business
risk. Furthermore, we believe that our processes and systems, the
transparency of our pricing, and our vehicle quality provide a
unique and ideal environment in which to procure high-quality
auto finance receivables, both for CAF and for third-party
lenders. CAF provides us the opportunity to capture additional
profits and cash flows from auto loan receivables while managing
our reliance on third-party finance sources.
CAF income does not include any allocation of indirect
costs or income. We present this information on a direct basis to
avoid making arbitrary decisions regarding the indirect benefit
or costs that could be attributed to this operation. Examples of
indirect costs not included are retail store expenses, retail
financing commissions, and corporate expenses such as human
resources, administrative services, marketing, information
systems, accounting, legal, treasury, and executive payroll.
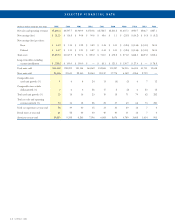
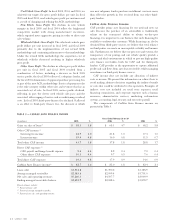
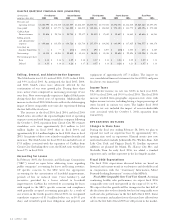
The components of CarMax Auto Finance income are
presented in Table 3.
TABLE 3 — CARMAX AUTO FINANCE INCOME
Years Ended February 28 or 29
(In millions) 2005 % 2004 % 2003 %
Gains on sales of loans(1) $ 58.3 3.8 $ 65.1 4.7 $ 68.2 5.8
Other CAF income:(2)
Servicing fee income 24.7 1.0 21.8 1.0 17.3 1.0
Interest income 19.0 0.8 16.0 0.8 11.5 0.7
Total other CAF income 43.7 1.8 37.8 1.8 28.8 1.7
Direct CAF expenses:(2)
CAF payroll and fringe benefit expense 9.0 0.4 8.2 0.4 7.0 0.4
Other direct CAF expenses 10.3 0.4 9.7 0.5 7.6 0.4
Total direct CAF expenses 19.3 0.8 17.9 0.9 14.6 0.9
CarMax Auto Finance income(3) $ 82.7 1.6 $ 85.0 1.8 $ 82.4 2.1
Loans sold $1,534.8 $1,390.2 $1,185.9
Average managed receivables $2,383.6 $2,099.4 $1,701.0
Net sales and operating revenues $5,260.3 $4,597.7 $3,969.9
Ending managed receivables balance $2,494.9 $2,248.6 $1,878.7
Percent columns indicate:
(1) Percent of loans sold.
(2) Percent of average managed receivables.
(3) Percent of net sales and operating revenues.