CVS 2006 Annual Report Download - page 54
Download and view the complete annual report
Please find page 54 of the 2006 CVS annual report below. You can navigate through the pages in the report by either clicking on the pages listed below, or by using the keyword search tool below to find specific information within the annual report.-
 1
1 -
2
-
3
-
4
-
5
-
6
-
7
-
8
-
9
-
10
-
11
-
12
-
13
-
14
-
15
-
16
-
17
-
18
-
19
-
20
-
21
-
22
-
23
-
24
-
25
-
26
-
27
-
28
-
29
-
30
-
31
-
32
-
33
-
34
-
35
-
36
-
37
-
38
-
39
-
40
-
41
-
42
-
43
-
 44
44 -
 45
45 -
 46
46 -
 47
47 -
 48
48 -
 49
49 -
 50
50 -
 51
51 -
 52
52 -
 53
53 -
 54
54 -
 55
55 -
 56
56 -
 57
57
 |
 |

2006 Annual Report 51
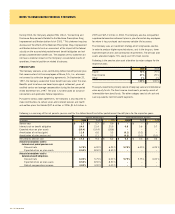
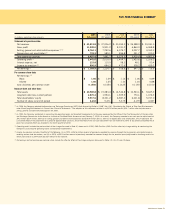
FIVE-YEAR FINANCIAL SUMMARY
2006 2005 2004 2003 2002
In millions, except per share amounts (52 weeks) (52 weeks) (52 weeks) (53 weeks) (52 weeks)
Statement of operations data:
Net revenues $ 43,813.8 $ 37,006.2 $ 30,594.3 $ 26,588.0 $ 24,181.5
Gross profit 11,939.0 9,901.2 8,031.2 6,863.0 6,068.8
Selling, general and administrative expenses (1) (2) 8,764.1 7,292.6 6,079.7 5,097.7 4,552.3
Depreciation and amortization (2) 733.3 589.1 496.8 341.7 310.3
Total operating expenses 9,497.4 7,881.7 6,576.5 5,439.4 4,862.6
Operating profit (3) 2,441.6 2,019.5 1,454.7 1,423.6 1,206.2
Interest expense, net 215.8 110.5 58.3 48.1 50.4
Income tax provision (4) 856.9 684.3 477.6 528.2 439.2
Net earnings (5) $ 1,368.9 $ 1,224.7 $ 918.8 $ 847.3 $ 716.6
Per common share data:
Net earnings: (5)
Basic $ 1.65 $ 1.49 $ 1.13 $ 1.06 $ 0.89
Diluted 1.60 1.45 1.10 1.03 0.88
Cash dividends per common share 0.1550 0.1450 0.1325 0.1150 0.1150
Balance sheet and other data:
Total assets $ 20,569.8 $ 15,283.4 $ 14,546.8 $ 10,543.1 $ 9,645.3
Long-term debt (less current portion) 2,870.4 1,594.1 1,925.9 753.1 1,076.3
Total shareholders’ equity 9,917.6 8,331.2 6,987.2 6,021.8 5,197.0
Number of stores (at end of period) 6,202 5,471 5,375 4,179 4,087
(1) In 2006, the Company adopted the Securities and Exchange Commission (SEC) Staff Accounting Bulletin (“SAB”) No. 108, “Considering the Effects of Prior Year Misstatements
when Quantifying Misstatements in Current Year Financial Statements.” The adoption of this statement resulted in a $40.2 million pre-tax ($24.7 million after-tax) decrease in
selling, general and administrative expenses for 2006.
(2) In 2004, the Company conformed its accounting for operating leases and leasehold improvements to the views expressed by the Office of the Chief Accountant of the Securities
and Exchange Commission to the American Institute of Certified Public Accountants on February 7, 2005. As a result, the Company recorded a non-cash pre-tax adjustment of
$9.0 million ($5.4 million after-tax) to selling, general and administrative expenses and $56.9 million ($35.1 after-tax) to depreciation and amortization, which represents the
cumulative effect of the adjustment for a period of approximately 20 years. Since the effect of this non-cash adjustment was not material to 2004, or any previously reported fiscal
year, the cumulative effect was recorded in the fourth quarter of 2004.
(3) Operating profit includes the pre-tax effect of the charge discussed in Note (1) above and in 2004, $65.9 million ($40.5 million after-tax) charge relating to conforming the
Company’s accounting for operating leases and leasehold improvements.
(4) Income tax provision includes the effect of the following: (i) in 2005, a $52.6 million reversal of previously recorded tax reserves through the tax provision principally based on
resolving certain state tax matters, and (ii) in 2004, a $60.0 million reversal of previously recorded tax reserves through the tax provision principally based on finalizing certain tax
return years and on a 2004 court decision relevant to the industry.
(5) Net earnings and net earnings per common share include the after-tax effect of the charges and gains discussed in Notes (1), (2), (3) and (4) above.