CVS 2006 Annual Report Download - page 24
Download and view the complete annual report
Please find page 24 of the 2006 CVS annual report below. You can navigate through the pages in the report by either clicking on the pages listed below, or by using the keyword search tool below to find specific information within the annual report.-
 1
1 -
2
-
3
-
4
-
5
-
6
-
7
-
8
-
9
-
10
-
11
-
12
-
13
-
 14
14 -
 15
15 -
 16
16 -
 17
17 -
 18
18 -
 19
19 -
 20
20 -
 21
21 -
 22
22 -
 23
23 -
 24
24 -
 25
25 -
 26
26 -
 27
27 -
 28
28 -
 29
29 -
 30
30 -
 31
31 -
 32
32 -
 33
33 -
 34
34 -
35
-
36
-
37
-
38
-
39
-
40
-
41
-
42
-
43
-
44
-
45
-
46
-
47
-
48
-
49
-
50
-
51
-
52
-
53
-
54
-
55
-
56
-
57
 |
 |

MANAGEMENT’S DISCUSSION AND ANALYSIS OF FINANCIAL CONDITION AND RESULTS OF OPERATIONS
2006 Annual Report 21
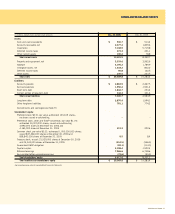
Interest expense, net consisted of the following:
In millions 2006 2005 2004
Interest expense $ 231.7 $ 117.0 $ 64.0
Interest income (15.9) (6.5) (5.7)
Interest expense, net $ 215.8 $ 110.5 $ 58.3
The increase in interest expense during 2006 and 2005 was due to a
combination of higher interest rates and higher average debt balances
resulting from the acquisitions of the Standalone Drug Business and the
2004 Acquired Businesses during 2006 and 2004, respectively.
Income tax provision. Our effective income tax rate was 38.5% in 2006,
35.8% in 2005 and 34.2% in 2004.
As you review our results in this area, we believe you should consider the
following important information:
• The effective income tax rate was negatively impacted during 2006 due
to the implementation of SFAS No. 123(R), as the compensation expense
associated with our employee stock purchase plan is not deductible for
income tax purposes unless, and until, any disqualifying dispositions occur.
• During the fourth quarters of 2006, 2005 and 2004, various events
resulted in the Company recording reductions of previously recorded
tax reserves through the income tax provision of $11.0 million,
$52.6 million and $60.0 million, respectively.
• For internal comparisons, management finds it useful to assess year-to-year
performance excluding the impact of the tax benefit in 2006, 2005
and 2004 discussed above, and uses 39.0%, 38.6% and 38.5% as
comparable effective tax rates for 2006, 2005 and 2004, respectively.
Net earnings increased $144.2 million or 11.8% to $1.4 billion (or
$1.60 per diluted share) in 2006. This compares to $1.2 billion
(or $1.45 per diluted share) in 2005, and $918.8 million (or $1.10 per
diluted share) in 2004. For internal comparisons, management finds it
useful to assess year-to-year performance excluding the $40.2 million
($24.7 million after-tax) SAB 108 Adjustments and the tax reversal
discussed above, and uses $1.3 billion (or $1.56 per diluted share) for
comparable net earnings in 2006. In addition, management finds it
useful to remove the $52.6 million tax reserve reversal discussed above,
and uses $1.2 billion (or $1.39 per diluted share) for comparable net
earnings in 2005. Further, management finds it useful to remove the
$40.5 million after-tax effect of the $65.9 million Lease Adjustment
to total operating expense and the $60.0 million tax reserve reversal,
discussed above, and uses $899.3 million (or $1.08 per diluted share)
for its internal comparisons in 2004.
Total operating expenses, which include store and administrative payroll,
employee benefits, store and administrative occupancy costs, selling
expenses, advertising expenses, administrative expenses and depreciation
and amortization expense increased to 21.7% of net revenues in 2006,
compared to 21.3% of net revenues in 2005 and 21.5% in 2004.
As you review our performance in this area, we believe you should consider
the following important information:
• Total operating expenses increased $60.7 million during 2006 as a result
of the adoption of the Statement of Financial Accounting Standards
(“SFAS”) No. 123(R), “Share-Based Payment.” In addition, total
operating expenses increased due to costs incurred to integrate the
Standalone Drug Business.
• Total operating expenses as a percentage of net revenues continued to
be impacted by an increase in the sale of generic drugs, which typically
have a lower selling price than their brand named equivalents.
• During the fourth quarter of 2006, we adopted Staff Accounting Bulletin
No. 108, “Considering the Effects of Prior Year Misstatements when
Quantifying Misstatements in Current Year Financial Statements” (“SAB
108”). In connection with adopting SAB 108, we recorded adjustments,
which collectively reduced total operating expenses by $40.2 million
(the “SAB 108 Adjustments”). Since the effects of the SAB 108
Adjustments were not material to 2006 or any previously reported
fiscal year, they were recorded in the fourth quarter of 2006. For
internal comparisons, management finds it useful to assess year-to-year
performance excluding the SAB 108 Adjustments, which results in
comparable 2006 total operating expenses as a percentage of net
revenues of 21.8%.
• During the fourth quarter of 2004, we conformed our accounting for
operating leases and leasehold improvements to the views expressed
by the Office of the Chief Accountant of the Securities and Exchange
Commission to the American Institute of Certified Public Accountants
on February 7, 2005. As a result, we recorded a $65.9 million non-cash
pre-tax adjustment to total operating expenses, which represents the
cumulative effect of the adjustment for a period of approximately
20 years (the “Lease Adjustment”). Since the Lease Adjustment
was not material to 2004 or any previously reported fiscal year, the
cumulative effect was recorded in the fourth quarter of 2004. For
internal comparisons, management finds it useful to assess year-to-year
performance excluding the Lease Adjustment, which results in comparable
2004 total operating expenses as a percentage of net revenues of 21.3%.
• Total operating expenses as a percentage of net revenues also increased
during 2004 due to integration and incremental costs as a result of
the acquisition of the 2004 Acquired Businesses. In addition, the
acquired stores had lower average revenues per store during 2004,
increasing operating expenses as a percentage of net sales.