CVS 2006 Annual Report Download - page 52
Download and view the complete annual report
Please find page 52 of the 2006 CVS annual report below. You can navigate through the pages in the report by either clicking on the pages listed below, or by using the keyword search tool below to find specific information within the annual report.-
 1
1 -
2
-
3
-
4
-
5
-
6
-
7
-
8
-
9
-
10
-
11
-
12
-
13
-
14
-
15
-
16
-
17
-
18
-
19
-
20
-
21
-
22
-
23
-
24
-
25
-
26
-
27
-
28
-
29
-
30
-
31
-
32
-
33
-
34
-
35
-
36
-
37
-
38
-
39
-
40
-
41
-
 42
42 -
 43
43 -
 44
44 -
 45
45 -
 46
46 -
 47
47 -
 48
48 -
 49
49 -
 50
50 -
 51
51 -
 52
52 -
 53
53 -
 54
54 -
 55
55 -
 56
56 -
 57
57
 |
 |

2006 Annual Report 49
NOTES TO CONSOLIDATED FINANCIAL STATEMENTS
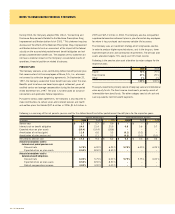
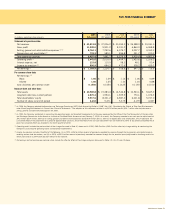
Following is a reconciliation of the Company’s business segments to the
consolidated financial statements:
Retail
Pharmacy PBM Intersegment Consolidated
In millions Segment Segment Eliminations Totals
2006
Net revenues $ 40,285.6 $ 3,683.7 $ (155.5) $ 43,813.8
Operating profit 2,123.5 318.1 2,441.6
Depreciation and
amortization 691.9 41.4 733.3
Total assets 19,038.8 1,531.0 20,569.8
Goodwill 2,572.4 622.8 3,195.2
Additions to
property and
equipment 1,750.5 18.4 1,768.9
2005
Net revenues $ 34,094.6 $ 2,956.2 $ (44.6) $ 37,006.2
Operating profit 1,797.1 222.4 2,019.5
Depreciation and
amortization 548.5 40.6 589.1
Total assets 13,878.5 1,404.9 15,283.4
Goodwill 1,152.4 637.5 1,789.9
Additions to
property and
equipment 1,471.3 24.1 1,495.4
2004
Net revenues $ 28,728.7 $ 1,865.6 $ 30,594.3
Operating profit 1,320.8 133.9 1,454.7
Depreciation and
amortization 471.1 25.7 496.8
Total assets 13,118.5 1,428.3 14,546.8
Goodwill 1,257.4 641.1 1,898.5
Additions to
property and
equipment 1,341.5 6.2 1,347.7
12 RECONCILIATION OF EARNINGS PER COMMON SHARE
Following is a reconciliation of basic and diluted earnings per common
share for the respective years:
In millions,
except per share amounts 2006 2005 2004
Numerator for
earnings per common
share calculation:
Net earnings $ 1,368.9 $ 1,224.7 $ 918.8
Preference dividends,
net of income
tax benefit (13.9) (14.1) (14.2)
Net earnings available
to common
shareholders, basic $ 1,355.0 $ 1,210.6 $ 904.6
Net earnings $ 1,368.9 $ 1,224.7 $ 918.8
Dilutive earnings
adjustment (4.2) (4.4) (5.2)
Net earnings available
to common
shareholders, diluted $ 1,364.7 $ 1,220.3 $ 913.6
Denominator for
earnings per common
share calculation:
Weighted average
common shares,
basic 820.6 811.4 797.2
Preference stock 18.8 19.5 20.4
Stock options 11.5 9.9 13.2
Restricted
stock units 2.3 0.8 –
Weighted average
common shares,
diluted 853.2 841.6 830.8
Basic earnings per
common share:
Net earnings $ 1.65 $ 1.49 $ 1.13
Diluted earnings per
common share:
Net earnings $ 1.60 $ 1.45 $ 1.10