CVS 2006 Annual Report Download - page 23
Download and view the complete annual report
Please find page 23 of the 2006 CVS annual report below. You can navigate through the pages in the report by either clicking on the pages listed below, or by using the keyword search tool below to find specific information within the annual report.-
 1
1 -
2
-
3
-
4
-
5
-
6
-
7
-
8
-
9
-
10
-
11
-
12
-
 13
13 -
 14
14 -
 15
15 -
 16
16 -
 17
17 -
 18
18 -
 19
19 -
 20
20 -
 21
21 -
 22
22 -
 23
23 -
 24
24 -
 25
25 -
 26
26 -
 27
27 -
 28
28 -
 29
29 -
 30
30 -
 31
31 -
 32
32 -
 33
33 -
34
-
35
-
36
-
37
-
38
-
39
-
40
-
41
-
42
-
43
-
44
-
45
-
46
-
47
-
48
-
49
-
50
-
51
-
52
-
53
-
54
-
55
-
56
-
57
 |
 |

MANAGEMENT’S DISCUSSION AND ANALYSIS OF FINANCIAL CONDITION AND RESULTS OF OPERATIONS
20 CVS Corporation
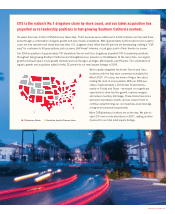
• Total net revenues continued to benefit from our active relocation
program, which moves existing in-line shopping center stores to
larger, more convenient, freestanding locations. Historically, we have
achieved significant improvements in customer count and net revenue
when we do this. As such, our relocation strategy remains an important
component of our overall growth strategy. As of December 30, 2006,
approximately 61% of our existing stores were freestanding, compared
to approximately 59% at December 31, 2005.
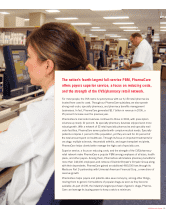
• During 2005, PharmaCare entered into certain risk-based or reinsurance
arrangements in connection with providing pharmacy plan management
services to prescription drug plans qualifying under Medicare Part D
and a prescription benefit plan for State of Connecticut employees.
Net premium revenue related to these contracts totaled $380.1 million
and $91.6 million during 2006 and 2005, respectively.
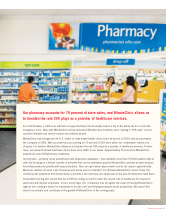
• Pharmacy revenue growth continued to benefit from new market
expansions, increased penetration in existing markets, the introduction
in 2006 of a prescription drug benefit under Medicare Part D, our ability
to attract and retain managed care customers and favorable industry
trends. These trends include an aging American population; many
“baby boomers” are now in their fifties and are consuming a greater
number of prescription drugs. The increased use of pharmaceuticals
as the first line of defense for individual healthcare also contributed
to the growing demand for pharmacy services. We believe these favorable
industry trends will continue.
• Pharmacy revenue dollars continue to be negatively impacted in all
years by the conversion of brand named drugs to equivalent generic
drugs, which typically have a lower selling price. In addition, our
pharmacy growth has also been adversely affected by the growth of
the mail order channel, a decline in the number of significant new
drug introductions, higher consumer co-payments and co-insurance
arrangements and an increase in the number of over-the-counter
remedies that had historically only been available by prescription. To
address the growth in mail order, we may choose not to participate in
certain prescription benefit programs that mandate filling maintenance
prescriptions through a mail order service facility. In the event we elect
to, for any reason, withdraw from current programs and/or decide not to
participate in future programs, we may not be able to sustain our
current rate of sales growth.
Gross profit, which includes net revenues less the cost of merchandise
sold during the reporting period and the related purchasing costs,
warehousing costs, delivery costs and actual and estimated inventory
losses, as a percentage of net revenues was 27.3% in 2006. This
compares to 26.8% in 2005 and 26.3% in 2004.
As you review our performance in this area, we believe you should
consider the following important information:
• Front store revenues increased as a percentage of total revenues during
2006. On average our gross profit on front store revenues is higher than
our gross profit on pharmacy revenues. Pharmacy revenues as a percentage
of total revenues during 2006 were 69.6%, compared to 70.2% in 2005
and 70.0% in 2004.
• Our pharmacy gross profit rate continued to benefit from an increase
in generic drug revenues in 2006, which normally yield a higher gross
profit rate than equivalent brand name drug revenues. However, increased
utilization of generic products has resulted in pressure to decrease
reimbursement payments to pharmacies for generic drugs, causing
a reduction in the generic profit rate. We expect this trend
to continue.
• Sales to customers covered by third party insurance programs have
continued to increase and, thus, have become a larger component of
our total pharmacy business. On average, our gross profit on third party
pharmacy revenues is lower than our gross profit on cash pharmacy
revenues. Third party pharmacy revenues were 94.7% of pharmacy
revenues in 2006, compared to 94.1% of pharmacy revenues in 2005
and 2004. We expect this trend to continue.
• The introduction of the new Medicare Part D benefit is resulting in
increased utilization and decreased pharmacy gross profit rates as
higher profit business (such as cash and state Medicaid customers)
continued to migrate to Part D coverage during 2006.
• On February 8, 2006, the President signed into law the Deficit Reduction
Act of 2005 (the “DRA”). The DRA seeks to reduce federal spending
by altering Medicaid reimbursement formula for multi-source (i.e.,
generic) drugs. According to the Congressional Budget Office, retail
pharmacies are expected to negotiate with individual states for higher
dispensing fees to mitigate the adverse effect of these changes. These
changes are currently scheduled to take effect late in the first quarter of
2007 and are expected to result in reduced Medicaid reimbursement
rates for retail pharmacies. The extent of these reductions cannot be
determined at this time.
• Our pharmacy gross profit rates have been adversely affected by the
efforts of managed care organizations, pharmacy benefit managers,
governmental and other third party payors to reduce their prescription
costs. In the event this trend continues, we may not be able to sustain
our current rate of revenue growth and gross profit dollars could be
adversely impacted.