CVS 2006 Annual Report Download - page 51
Download and view the complete annual report
Please find page 51 of the 2006 CVS annual report below. You can navigate through the pages in the report by either clicking on the pages listed below, or by using the keyword search tool below to find specific information within the annual report.-
 1
1 -
2
-
3
-
4
-
5
-
6
-
7
-
8
-
9
-
10
-
11
-
12
-
13
-
14
-
15
-
16
-
17
-
18
-
19
-
20
-
21
-
22
-
23
-
24
-
25
-
26
-
27
-
28
-
29
-
30
-
31
-
32
-
33
-
34
-
35
-
36
-
37
-
38
-
39
-
40
-
 41
41 -
 42
42 -
 43
43 -
 44
44 -
 45
45 -
 46
46 -
 47
47 -
 48
48 -
 49
49 -
 50
50 -
 51
51 -
 52
52 -
 53
53 -
 54
54 -
 55
55 -
 56
56 -
 57
57
 |
 |

48 CVS Corporation
NOTES TO CONSOLIDATED FINANCIAL STATEMENTS
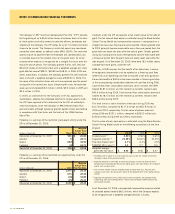
Following is a reconciliation of the statutory income tax rate to the
Company’s effective tax rate for the respective years:
2006 2005 2004
Statutory income tax rate 35.0 % 35.0 % 35.0 %
State income taxes,
net of federal
tax benefit 3.9 3.9 3.8
Other 0.1 (0.3) (0.3)
Federal and net state
reserve release (0.5) (2.8) (4.3)
Effective tax rate 38.5 % 35.8 % 34.2 %
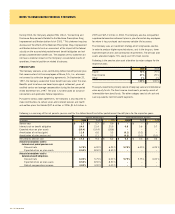
Following is a summary of the significant components of the Company’s
deferred tax assets and liabilities as of the respective balance sheet dates:
In millions Dec. 30, 2006 Dec. 31, 2005
Deferred tax assets:
Lease and rents $ 265.8 $ 258.3
Inventory 74.3 124.0
Employee benefits 82.4 60.8
Accumulated other
comprehensive items 41.8 53.5
Retirement benefits 4.0 11.0
Allowance for bad debt 36.6 22.1
Amortization method – 16.9
Other 68.5 38.7
NOL 26.3 4.7
Total deferred tax assets 599.7 590.0
Deferred tax liabilities:
Accelerated depreciation (233.7) (226.4)
Amortization method (0.9) –
Total deferred tax liabilities (234.6) (226.4)
Net deferred tax assets $ 365.1 $ 363.6
During the fourth quarters of 2005 and 2004, an assessment of tax
reserves resulted in the Company recording reductions of previously
recorded tax reserves through the income tax provision of $52.6 million
and $60.0 million, respectively.
The Company believes it is more likely than not that the deferred tax
assets included in the above table will be realized during future periods.
11 BUSINESS SEGMENTS
The Company currently operates two business segments, Retail Pharmacy
and Pharmacy Benefit Management (“PBM”).
The operating segments are segments of the Company for which separate
financial information is available and for which operating results are
evaluated regularly by executive management in deciding how to allocate
resources and in assessing performance.
As of December 30, 2006, the Retail Pharmacy segment included
6,150 retail drugstores, the Company’s online retail website, CVS.com®
and its retail healthcare clinics. The clinics utilize nationally recognized
medical protocols to diagnose and treat minor health conditions and are
staffed by board-certified nurse practitioners and physician assistants. The
retail healthcare clinics operate under the MinuteClinic® name and include
146 clinics located in 18 states, of which 129 are located within CVS retail
drugstores. The retail drugstores are located in 40 states and the District
of Columbia and operate under the CVS® or CVS/pharmacy® name.
The PBM segment provides a full range of prescription benefit management
services to managed care providers and other organizations. These services
include mail order pharmacy services, specialty pharmacy services, plan
design and administration, formulary management and claims processing,
as well as providing reinsurance services in conjunction with prescription
drug benefit polices.
The specialty pharmacy business, which includes retail pharmacy products,
primarily focuses on supporting individuals that require complex and
expensive drug therapies. The PBM segment operates under the PharmaCare
Management Services and PharmaCare Pharmacy® names and includes
52 retail pharmacies, located in 22 states and the District of Columbia.
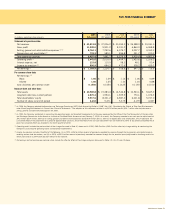
Following is a reconciliation of the significant components of the
Company’s net revenues for the respective years:
2006 2005 2004
Pharmacy 69.6 % 70.2 % 70.0 %
Front store 30.4 29.8 30.0
100.0 % 100.0 % 100.0 %
The Company evaluates segment performance based on operating
profit before the effect of non-recurring charges and gains and certain
intersegment activities and charges, including pharmacy revenues
reported by the retail segment that are directly related to premium
revenues that are reported by the PBM segment. The accounting
policies of the segments are substantially the same as those described
in Note 1.