CVS 2006 Annual Report Download - page 45
Download and view the complete annual report
Please find page 45 of the 2006 CVS annual report below. You can navigate through the pages in the report by either clicking on the pages listed below, or by using the keyword search tool below to find specific information within the annual report.-
 1
1 -
2
-
3
-
4
-
5
-
6
-
7
-
8
-
9
-
10
-
11
-
12
-
13
-
14
-
15
-
16
-
17
-
18
-
19
-
20
-
21
-
22
-
23
-
24
-
25
-
26
-
27
-
28
-
29
-
30
-
31
-
32
-
33
-
34
-
 35
35 -
 36
36 -
 37
37 -
 38
38 -
 39
39 -
 40
40 -
 41
41 -
 42
42 -
 43
43 -
 44
44 -
 45
45 -
 46
46 -
 47
47 -
 48
48 -
 49
49 -
 50
50 -
 51
51 -
 52
52 -
 53
53 -
 54
54 -
 55
55 -
56
-
57
 |
 |

42 CVS Corporation
NOTES TO CONSOLIDATED FINANCIAL STATEMENTS
All grants under the ICP are awarded at fair market value on the date of
grant. The fair value of stock options is estimated using the Black-Scholes
Option Pricing Model and compensation expense is recognized on a
straight-line basis over the requisite service period. Options granted prior
to 2004 generally become exercisable over a four-year period from the
grant date and expire ten years after the date of grant. Options granted
during and subsequent to fiscal 2004 generally become exercisable over
a three-year period from the grant date and expire seven years after the
date of grant. As of December 30, 2006, there were 18.0 million shares
available for future grants under the ICP.
SFAS No. 123(R) requires that the benefit of tax deductions in excess
of recognized compensation cost be reported as a financing cash flow,
rather than as an operating cash flow as required under prior guidance.
Excess tax benefits of $42.6 million were included in financing activities
in the accompanying consolidated statement of cash flow during 2006.
Cash received from stock options exercised, which includes the ESPP,
totaled $187.6 million and the related tax benefits realized were
$42.6 million during 2006. Cash received from stock options exercised
totaled $178.4 million and the related tax benefits realized were
$46.6 million during 2005.
The total intrinsic value of options exercised during 2006 was
$117.8 million, compared to $117.5 million and $51.9 million in
2005 and 2004, respectively. The fair value of options exercised
during 2006 was $257.1 million, compared to $263.3 million and
$156.8 million during 2005 and 2004, respectively.
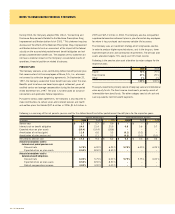
The fair value of each stock option is estimated using the Black-Scholes
Option Pricing Model based on the following assumptions at the time
of grant:
2006 2005 2004
Dividend yield (1) 0.50 % 0.56 % 0.65 %
Expected volatility (2) 24.58 % 34.00 % 30.50 %
Risk-free interest rate (3) 4.7 % 4.3 % 3.9 %
Expected life (in years) (4) 4.2 5.7 6.6
Weighted average
grant date fair value $ 8.46 $ 8.46 $ 6.47
(1) Dividend yield is based on annual dividends paid and the fair market value of the
Company’s stock at the period end date.
(2) Expected volatility is estimated utilizing the Company’s historical volatility over a
period equal to the expected life of each option grant after adjustments for infrequent
events such as stock splits.
(3) The risk-free interest rate was selected based on yields from U.S. Treasury zero-
coupon issues with a remaining term equal to the expected term of the options being
valued.
(4) Expected life represents the number of years that the options are expected to be
outstanding from grant date based on historical data of option holder exercise and
termination behavior.
As of December 30, 2006, unrecognized compensation expense related
to unvested options totaled $66.3 million, which the Company expects
to be recognized over a weighted average period of 1.4 years.
The Company’s 1997 Incentive Compensation Plan (the “ICP”) provides
for the granting of up to 85.8 million shares of common stock in the form
of stock options and other awards to selected officers, employees and
directors of the Company. The ICP allows for up to 7.2 million restricted
shares to be issued. The Company’s restricted awards are considered
nonvested share awards as defined under SFAS 123(R). The restricted
awards require no payment from the employee and compensation cost
is recorded based on the market price on the grant date, for which
compensation expense is recognized on a straight-line basis over the
requisite service period. The Company granted 5,000, 427,000 and
824,000 shares of restricted stock with a weighted average per share
grant date fair value of $28.71, $24.80 and $18.41, in 2006, 2005 and
2004, respectively. In addition, the Company granted 673,000 restricted
stock units with a weighted average fair value of $29.40 in 2006. The
fair value of the restricted shares and units are expensed over the period
during which the restrictions lapse. Compensation costs for restricted
shares and units totaled $9.2 million in 2006, $5.9 million in 2005 and
$2.4 million in 2004.
In 2004, an amendment to the Company’s ICP was approved by
shareholders, allowing non-employee directors to receive awards under
the ICP. Upon approval of this amendment to the ICP, all authority to
make future grants under the Company’s 1996 Directors Stock Plan
was terminated, although previously granted awards remain outstanding
in accordance with their terms and the terms of the 1996 Directors
Stock Plan.
Following is a summary of the restricted share award activity under the
ICP as of December 30, 2006:
Weighted
Average Grant
Shares in thousands Shares Date Fair Value
Nonvested at December 31, 2005 501 $ 20.80
Granted 5 28.71
Vested (197) 18.94
Forfeited (3) 24.71
Nonvested at December 30, 2006 306 $ 22.08
Following is a summary of the restricted unit award activity under the
ICP as of December 30, 2006:
Weighted
Average Grant
Units in thousands Units Date Fair Value
Nonvested at December 31, 2005 1,377 $ 23.10
Granted 673 29.40
Vested (16) 33.80
Forfeited (25) 25.22
Nonvested at December 30, 2006 2,009 $ 25.22