CVS 2006 Annual Report Download - page 25
Download and view the complete annual report
Please find page 25 of the 2006 CVS annual report below. You can navigate through the pages in the report by either clicking on the pages listed below, or by using the keyword search tool below to find specific information within the annual report.-
 1
1 -
2
-
3
-
4
-
5
-
6
-
7
-
8
-
9
-
10
-
11
-
12
-
13
-
14
-
 15
15 -
 16
16 -
 17
17 -
 18
18 -
 19
19 -
 20
20 -
 21
21 -
 22
22 -
 23
23 -
 24
24 -
 25
25 -
 26
26 -
 27
27 -
 28
28 -
 29
29 -
 30
30 -
 31
31 -
 32
32 -
 33
33 -
 34
34 -
 35
35 -
36
-
37
-
38
-
39
-
40
-
41
-
42
-
43
-
44
-
45
-
46
-
47
-
48
-
49
-
50
-
51
-
52
-
53
-
54
-
55
-
56
-
57
 |
 |

MANAGEMENT’S DISCUSSION AND ANALYSIS OF FINANCIAL CONDITION AND RESULTS OF OPERATIONS
22 CVS Corporation
LIQUIDITY & CAPITAL RESOURCES
We anticipate that our cash flow from operations, supplemented by
commercial paper and long-term borrowings, will continue to fund the
future growth of our business.
Net cash provided by operating activities increased to $1.7 billion in 2006.
This compares to $1.6 billion in 2005 and $0.9 billion in 2004. The
increase in net cash provided by operations during 2006 primarily
resulted from an increase in cash receipts from revenues. Fiscal 2005
reflected increased revenues and improved inventory management.
Net cash used in investing activities increased to $4.6 billion in 2006.
This compares to $0.9 billion in 2005 and $3.2 billion in 2004. The
increase in net cash provided by investing activities was primarily due
to the acquisition of the Standalone Drug Business. The decrease in
net cash used in investing activities during 2005 related to a decrease
in acquisitions, as 2004 included the acquisition of the 2004 Acquired
Businesses. Gross capital expenditures totaled $1.8 billion during 2006,
compared to $1.5 billion in 2005 and $1.3 billion in 2004. During
2006, approximately 51% of our total capital expenditures were for
new store construction, 30% for store expansion and improvements
and 19% for technology and other corporate initiatives.
During 2007, we currently plan to invest over $1.7 billion in gross
capital expenditures, which will include spending for approximately
250–275 new or relocated stores.
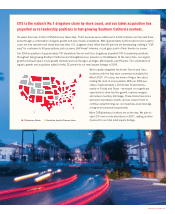
Following is a summary of our store development activity for the
respective years:
2006 2005 2004
Total stores
(beginning of year) 5,471 5,375 4,179
New and acquired stores 848 166 1,397
Closed stores (117) (70) (201)
Total stores (end of year) 6,202 5,471 5,375
Relocated stores (1) 118 131 96
(1) Relocated stores are not included in new or closed store totals.
Net cash provided by financing activities was $2.9 billion in 2006, compared
to net cash used in financing activities of $579.4 million in 2005 and
net cash provided by financing activities of $1.8 billion in 2004. The
increase in net cash provided by financing activities was primarily due
to the financing of the acquisition of the Standalone Drug Business,
including issuance of the Notes (defined below), during the third quarter
of 2006. This increase was offset partially by the repayment of the
$300 million, 5.625% unsecured senior notes, which matured during
the first quarter of 2006. Fiscal 2005 reflected a reduction in short-term
borrowings. During 2006, we paid common stock dividends totaling
$140.9 million, or $0.155 per common share. In January 2007, our
Board of Directors authorized a 26% increase in our annualized common
stock dividend to $0.195 per share for 2007.
We believe that our current cash on hand and cash provided by operations,
together with our ability to obtain additional short-term and long-term
financing, will be sufficient to cover our working capital needs, capital
expenditures, debt service requirements and dividend requirements for
at least the next twelve months and the foreseeable future.
We had $1.8 billion of commercial paper outstanding at a weighted
average interest rate of 5.3% as of December 30, 2006. In connection
with our commercial paper program, we maintain a $675 million, five-year
unsecured back-up credit facility, which expires on June 11, 2009 and
a $675 million five-year unsecured back-up credit facility, which expires
on June 2, 2010. In preparation for the consummation of the acquisition
of the Standalone Drug Business, we entered into a $1.4 billion, five-year
unsecured back-up credit facility, which expires on May 12, 2011. The
credit facilities allow for borrowings at various rates that are dependent
in part on our public debt rating. As of December 30, 2006, we had no
outstanding borrowings against the credit facilities.
On August 15, 2006, we issued $800 million of 5.75% unsecured senior
notes due August 15, 2011 and $700 million of 6.125% unsecured
senior notes due August 15, 2016 (collectively the “Notes”). The Notes
pay interest semi-annually and may be redeemed at any time, in whole
or in part at a defined redemption price plus accrued interest. Net proceeds
from the Notes were used to repay a portion of the outstanding commercial
paper issued to finance the Standalone Drug Business. To manage a
portion of the risk associated with potential changes in market interest
rates, during the second quarter of 2006, we entered into forward
starting pay fixed rate swaps (the “Swaps”), with a notional amount of
$750 million. The Swaps settled in conjunction with the placement of
the long-term financing. As of December 30, 2006, we had no
freestanding derivatives in place.