CVS 2006 Annual Report Download - page 47
Download and view the complete annual report
Please find page 47 of the 2006 CVS annual report below. You can navigate through the pages in the report by either clicking on the pages listed below, or by using the keyword search tool below to find specific information within the annual report.-
 1
1 -
2
-
3
-
4
-
5
-
6
-
7
-
8
-
9
-
10
-
11
-
12
-
13
-
14
-
15
-
16
-
17
-
18
-
19
-
20
-
21
-
22
-
23
-
24
-
25
-
26
-
27
-
28
-
29
-
30
-
31
-
32
-
33
-
34
-
35
-
36
-
 37
37 -
 38
38 -
 39
39 -
 40
40 -
 41
41 -
 42
42 -
 43
43 -
 44
44 -
 45
45 -
 46
46 -
 47
47 -
 48
48 -
 49
49 -
 50
50 -
 51
51 -
 52
52 -
 53
53 -
 54
54 -
 55
55 -
 56
56 -
 57
57
 |
 |

44 CVS Corporation
NOTES TO CONSOLIDATED FINANCIAL STATEMENTS
2005 and $15.0 million in 2004. The Company also has nonqualified
supplemental executive retirement plans in place for certain key employees
for whom it has purchased cost recovery variable life insurance.
The Company uses an investment strategy, which emphasizes equities
in order to produce higher expected returns, and in the long run, lower
expected expense and cash contribution requirements. The pension plan
assets allocation targets 70% equity and 30% fixed income.
Following is the pension plan asset allocation by major category for the
respective years:
2006 2005
Equity 72 % 70 %
Fixed Income 27 % 29 %
Other 1 % 1 %
100 % 100 %
The equity investments primarily consist of large cap value and international
value equity funds. The fixed income investments primarily consist of
intermediate-term bond funds. The other category consists of cash and
cash equivalents held for benefit payments.
During 2004, the Company adopted FAS 106-2, “Accounting and
Disclosure Requirements Related to the Medicare Prescription Drug,
Improvement and Modernization Act of 2003.” This statement requires
disclosure of the effects of the Medicare Prescription Drug, Improvement
and Modernization Act and an assessment of the impact of the federal
subsidy on the accumulated postretirement benefit obligation and net
periodic postretirement benefit cost. The adoption of this statement did
not have a material impact on the Company’s consolidated results of
operations, financial position or related disclosures.
PENSION PLANS
The Company sponsors a non-contributory defined benefit pension plan
that covers certain full-time employees of Revco, D.S., Inc. who were
not covered by collective bargaining agreements. On September 20,
1997, the Company suspended future benefit accruals under this plan.
Benefits paid to retirees are based upon age at retirement, years of
credited service and average compensation during the five-year period
ended September 20, 1997. The plan is funded based on actuarial
calculations and applicable federal regulations.
Pursuant to various labor agreements, the Company is also required to
make contributions to certain union-administered pension and health
and welfare plans that totaled $37.6 million in 2006, $15.4 million in
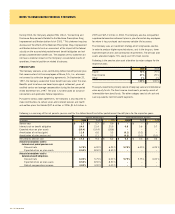
Following is a summary of the net periodic pension cost for the defined benefit and other postretirement benefit plans for the respective years:
Defined Benefit Plans Other Postretirement Benefits
In millions 2006 2005 2004 2006 2005 2004
Service cost $ 1.7 $ 0.7 $ 0.9 $ – $ – $ –
Interest cost on benefit obligation 24.0 21.4 20.5 0.6 0.6 0.7
Expected return on plan assets (20.4) (19.4) (18.6) – – –
Amortization of net loss (gain) 11.8 6.6 3.3 (0.1) (0.2) –
Amortization of prior service cost 0.1 0.1 0.1 (0.2) (0.1) (0.1)
Net periodic pension cost $ 17.2 $ 9.4 $ 6.2 $ 0.3 $ 0.3 $ 0.6
Actuarial assumptions used to
determine net period pension cost:
Discount rate 5.75 % 6.00 % 6.25 % 5.75 % 6.00 % 6.25 %
Expected return on plan assets 8.50 % 8.50 % 8.50 % – – –
Actuarial assumptions used to
determine benefit obligations:
Discount rate 6.00 % 5.75 % 6.00 % 5.75 % 5.75 % 6.00 %
Expected return on plan assets 8.50 % 8.50 % 8.50 % – – –
Rate of compensation increase 4.00 % 4.00 % 4.00 % – – –