Blackberry 2003 Annual Report Download - page 49
Download and view the complete annual report
Please find page 49 of the 2003 Blackberry annual report below. You can navigate through the pages in the report by either clicking on the pages listed below, or by using the keyword search tool below to find specific information within the annual report.-
 1
1 -
2
-
3
-
4
-
5
-
6
-
7
-
8
-
9
-
10
-
11
-
12
-
13
-
14
-
15
-
16
-
17
-
18
-
19
-
20
-
21
-
22
-
23
-
24
-
25
-
26
-
27
-
28
-
29
-
30
-
31
-
32
-
33
-
34
-
35
-
36
-
37
-
38
-
 39
39 -
 40
40 -
 41
41 -
 42
42 -
 43
43 -
 44
44 -
 45
45 -
 46
46 -
 47
47 -
 48
48 -
 49
49 -
 50
50 -
 51
51 -
 52
52 -
 53
53 -
 54
54 -
 55
55 -
 56
56
 |
 |

46
ResearchInMotionLimited|IncorporatedUndertheLawsofOntario(UnitedStatesdollars,inthousandsexceptpersharedataorasotherwiseindicated)
47
FortheyearsendedMarch1,2003,March2,2002andFebruary28,2001
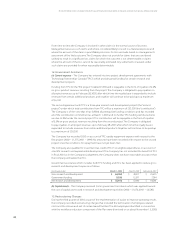
inprevailinginterestrates.TheCompanydoesnotcurrentlyuseinterestratederivativenancial
instrumentsinitsinvestmentportfolio.
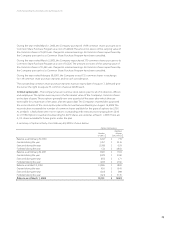
TheCompany,inthenormalcourseofbusiness,monitorsthenancialconditionofitscustomersand
reviewsthecredithistoryofeachnewcustomer.TheCompanyestablishesanallowancefordoubtful
accountsthatcorrespondstothespeciccreditriskofitscustomers,historicaltrendsandeconomic
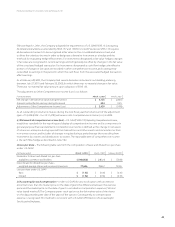
circumstances.TheallowanceasatMarch1,2003is$2,331(2002–$2,218).
WhiletheCompanysellstoavarietyofcustomers,threecustomerscomprised17%,16%,and14%
oftradereceivablesasatMarch1,2003(2002–twocustomerscomprised16%and15%).Additionally,
onecustomercomprised12%oftheCompany’ssales(2002–twocustomerscomprised17%and
11%,2001–onecustomercomprised18%).
ForcertainoftheCompany’snancialinstruments,includingtradereceivables,otherreceivables,
accountspayableandaccruedliabilities,thecarryingamountsapproximatetheirrespectivefairvalues
duetotheirshortmaturities.Cashandcashequivalents,marketablesecuritiesandlong-termdebtare
carriedatcost,whichapproximatestheirrespectivefairvalues.
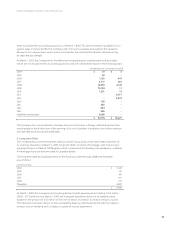
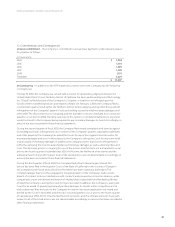
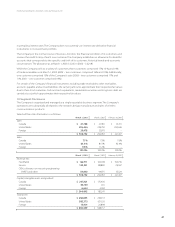
19.SegmentDisclosures
TheCompanyisorganizedandmanagedasasinglereportablebusinesssegment.TheCompany’s
operationsaresubstantiallyallrelatedtotheresearch,design,manufactureandsalesofwireless
communicationsproducts.
Selectednancialinformationisasfollows:
March1,2003 March2,2002 February28,2001
Sales
Canada $ 21,788 $ 21,381 $ 16,721
UnitedStates 255,466 239,702 204,606
Foreign 29,478 32,970 –
$ 306,732 $ 294,053 $ 221,327
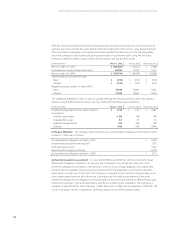
Sales
Canada 7.1% 7.3% 7.6%
UnitedStates 83.3% 81.5% 92.4%
Foreign 9.6% 11.2% –
100.0% 100.0% 100.0%
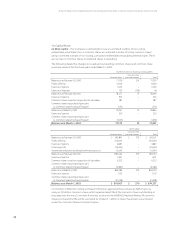
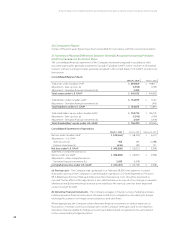
March1,2003 March2,2002 February28,2001
Revenuemix
Handhelds $ 122,711 $ 160,198 $ 156,736
Service 129,331 88,880 29,067
OEM,software,non-recurringengineering
(“NRE”)andother 54,690 44,975 35,524
$ 306,732 $ 294,053 $ 221,327
Capital,intangibleassetsandgoodwill
Canada $ 207,221 $ 175,406
UnitedStates 30,759 651
Foreign 6,662 6,184
$ 244,642 $ 182,241
Totalassets
Canada $ 258,833 $ 290,133
UnitedStates 585,375 631,126
Foreign 15,401 26,898
$ 859,609 $ 948,157