Blackberry 2003 Annual Report Download - page 30
Download and view the complete annual report
Please find page 30 of the 2003 Blackberry annual report below. You can navigate through the pages in the report by either clicking on the pages listed below, or by using the keyword search tool below to find specific information within the annual report.-
 1
1 -
2
-
3
-
4
-
5
-
6
-
7
-
8
-
9
-
10
-
11
-
12
-
13
-
14
-
15
-
16
-
17
-
18
-
19
-
 20
20 -
 21
21 -
 22
22 -
 23
23 -
 24
24 -
 25
25 -
 26
26 -
 27
27 -
 28
28 -
 29
29 -
 30
30 -
 31
31 -
 32
32 -
 33
33 -
 34
34 -
 35
35 -
 36
36 -
 37
37 -
 38
38 -
 39
39 -
 40
40 -
41
-
42
-
43
-
44
-
45
-
46
-
47
-
48
-
49
-
50
-
51
-
52
-
53
-
54
-
55
-
56
 |
 |

28
ResearchInMotionLimited|IncorporatedUndertheLawsofOntario(UnitedStatesdollars,inthousandsexceptpersharedataorasotherwiseindicated)
29
FortheyearsendedMarch1,2003,March2,2002andFebruary28,2001
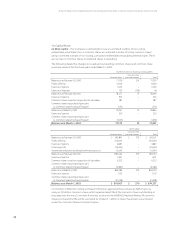
ConsolidatedStatements
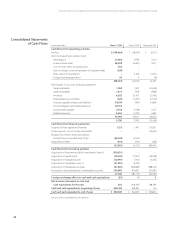
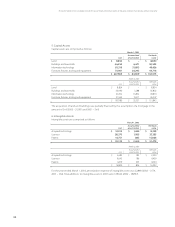
ofCashFlows Fortheyearended March1,2003 March2,2002 February28,2001
Cashowsfromoperatingactivities
Netloss $(148,664) $ (28,479) $ (6,211)
Itemsnotrequiringanoutlayofcash:
Amortization 31,600 17,740 9,123
Futureincometaxes 28,598 (16,921) 5,011
Lossonwrite-downofcapitalassets 502 – –
Gainonforeigncurrencytranslationoflongtermdebt (359) – –
Write-downofinvestments – 5,350 14,750
Foreignexchangegain(loss) 20 4 (8)
(88,303) (22,306) 22,665
Netchangesinnon-cashworkingcapitalitems
Tradereceivables 1,958 7,607 (23,029)
Otherreceivables 1,473 7,918 (7,859)
Inventory 6,202 30,567 (31,192)
Prepaidexpensesandother (525) (3,467) (17,730)
Accountspayableandaccruedliabilities 24,614 (499) 34,859
Accruedlitigationandrelatedexpenses 50,702 – –
Incometaxespayable 2,106 (1,018) 2,027
Deferredrevenue 4,563 (1,097) 4,593
91,093 40,011 (38,331)
2,790 17,705 (15,666)
Cashowsfromnancingactivities
Issuanceofsharecapitalandwarrants 1,155 1,491 615,551
Financingcosts,netofincometaxbenets – – (30,462)
Buybackofcommonsharespursuantto
NormalCourseIssuerBid(note10(a)) (24,502) (5,525) –
Repaymentofdebt (614) (303) (185)
(23,961) (4,337) 584,904
Cashowsfrominvestingactivities
Acquisitionoflong-termportfolioinvestments(note4) (190,030) – –
Acquisitionofcapitalassets (39,670) (73,917) (59,058)
Acquisitionofintangibleassets (30,997) (7,106) (6,503)
Acquisitionofsubsidiaries(note7) (21,990) (9,709) –
Acquisitionofmarketablesecurities (41,900) (925,885) (388,672)
Proceedsonsaleandmaturityofmarketablesecurities 345,983 834,907 393,683
21,396 (181,710) (60,550)
Foreignexchangeeffectoncashandcashequivalents (20) (4) 8
Netincrease(decrease)incashand
cashequivalentsfortheyear 205 (168,346) 508,696
Cashandcashequivalents,beginningofyear 340,476 508,822 126
Cashandcashequivalents,endofyear$ 340,681 $ 340,476 $ 508,822
Seenotestotheconsolidatednancialstatements.