Bed, Bath and Beyond 2014 Annual Report Download - page 8
Download and view the complete annual report
Please find page 8 of the 2014 Bed, Bath and Beyond annual report below. You can navigate through the pages in the report by either clicking on the pages listed below, or by using the keyword search tool below to find specific information within the annual report.-
 1
1 -
 2
2 -
 3
3 -
 4
4 -
 5
5 -
 6
6 -
 7
7 -
 8
8 -
 9
9 -
 10
10 -
 11
11 -
 12
12 -
 13
13 -
 14
14 -
 15
15 -
 16
16 -
 17
17 -
 18
18 -
 19
19 -
20
-
21
-
22
-
23
-
24
-
25
-
26
-
27
-
28
-
29
-
30
-
31
-
32
-
33
-
34
-
35
-
36
-
37
-
38
-
39
-
40
-
41
-
42
-
43
-
44
-
45
-
46
-
47
-
48
-
49
-
50
-
51
-
52
-
53
-
54
-
55
-
56
-
57
-
58
-
59
-
60
-
61
-
62
-
63
-
64
-
65
-
66
-
67
-
68
-
69
-
70
-
71
-
72
-
73
-
74
-
75
-
76
-
77
-
78
-
79
-
80
 |
 |
websites and mobile applications increased in excess of 50%, over the corresponding period in the prior year, while
comparable sales consummated in-store were relatively flat to the corresponding period in the prior year. Comparable
sales percentages are calculated based on an equivalent number of weeks for each annual period.
Comparable sales include sales consummated through all retail channels which have been operating for twelve
full months following the opening period (typically four to six weeks). The Company is an omnichannel retailer with
capabilities that allow a customer to use more than one channel when making a purchase, including in-store, online and
mobile channels, and have it fulfilled, in most cases, either through in-store customer pickup or by direct shipment to the
customer from one of the Company’s distribution facilities, stores or vendors.
Sales consummated on a mobile device while physically in a store location are recorded as customer facing online
websites and mobile applications sales. Customer orders reserved online and picked up in a store are recorded as an
in-store sale. In-store sales are reduced by sales originally consummated from customer facing online websites and mobile
applications and subsequently returned in-store.
Stores relocated or expanded are excluded from comparable sales if the change in square footage would cause
meaningful disparity in sales over the prior period. In the case of a store to be closed, such store’s sales are not considered
comparable once the store closing process has commenced. Linen Holdings is excluded from the comparable sales
calculations and will continue to be excluded on an ongoing basis as it represents non-retail activity. Cost Plus World
Market was excluded from the comparable sales calculations through the end of the fiscal first half of 2013, and is
included beginning with the fiscal third quarter of 2013.
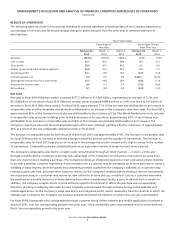
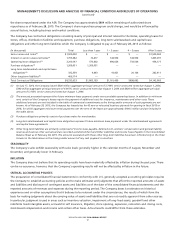
• Gross profit for fiscal 2014 was $4.620 billion or 38.9% of net sales compared with $4.566 billion or 39.7% of net sales for
fiscal 2013 and $4.389 billion or 40.2% of net sales for fiscal 2012.
• Selling, general and administrative expenses (‘‘SG&A’’) for fiscal 2014 were $3.065 billion or 25.8% of net sales compared
with $2.951 billion or 25.7% of net sales for fiscal 2013 and $2.751 billion or 25.2% of net sales for fiscal 2012.
• Interest expense was $50.5 million, $1.1 million and $4.2 million in fiscal 2014, 2013 and 2012, respectively.
• The effective tax rate was 36.3%, 36.6% and 36.5% for fiscal years 2014, 2013 and 2012, respectively. The tax rate
included discrete tax items resulting in net benefits of approximately $20.0 million, $20.0 million and $26.7 million,
respectively, for fiscal 2014, 2013 and 2012.
• For the fiscal year ended February 28, 2015 (fifty-two weeks), net earnings per diluted share were $5.07 ($957.5 million),
an increase of approximately 6%, as compared with net earnings per diluted share of $4.79 ($1.022 billion) for fiscal
2013 (fifty-two weeks), which was an increase of approximately 5% from net earnings per diluted share of $4.56
($1.038 billion) for fiscal 2012 (fifty-three weeks). For the fiscal year ended February 28, 2015, the increase in net earnings
per diluted share is the result of the impact of the Company’s repurchases of its common stock, partially offset by the
decrease in net earnings as a result of the items described above. Included in net earnings for the fiscal year ended
February 28, 2015 is a net benefit of approximately $0.04 per diluted share for certain non-recurring items, including a
credit card fee litigation settlement. For the fiscal year ended March 1, 2014, the increase in net earnings per diluted
share is the result of the items described above and the impact of the Company’s repurchases of its common stock,
partially offset by a reduction of approximately $0.06 to $0.07 per diluted share as a result of the disruptive weather in
the fiscal fourth quarter.
Capital expenditures for fiscal 2014, 2013 and 2012 were $330.6 million, $320.8 million and $315.9 million, respectively. Slightly
more than half of the current year capital expenditures were for technology enhancements with the remaining balance being
used primarily for new stores, existing store improvements and other projects important to the Company’s future. The
Company remains committed to making the required investments in its infrastructure to help position the Company for
continued growth and success. The Company continues to review and prioritize its capital needs while continuing to make
investments, principally for information technology enhancements, including omnichannel capabilities, new stores, existing
store improvements, and other projects whose impact is considered important to its future.
MANAGEMENT’S DISCUSSION AND ANALYSIS OF FINANCIAL CONDITION AND RESULTS OF OPERATIONS
(continued)
BED BATH & BEYOND 2014 ANNUAL REPORT
6