Bed, Bath and Beyond 2014 Annual Report Download - page 2
Download and view the complete annual report
Please find page 2 of the 2014 Bed, Bath and Beyond annual report below. You can navigate through the pages in the report by either clicking on the pages listed below, or by using the keyword search tool below to find specific information within the annual report.-
 1
1 -
 2
2 -
 3
3 -
 4
4 -
 5
5 -
 6
6 -
 7
7 -
 8
8 -
 9
9 -
 10
10 -
 11
11 -
 12
12 -
 13
13 -
14
-
15
-
16
-
17
-
18
-
19
-
20
-
21
-
22
-
23
-
24
-
25
-
26
-
27
-
28
-
29
-
30
-
31
-
32
-
33
-
34
-
35
-
36
-
37
-
38
-
39
-
40
-
41
-
42
-
43
-
44
-
45
-
46
-
47
-
48
-
49
-
50
-
51
-
52
-
53
-
54
-
55
-
56
-
57
-
58
-
59
-
60
-
61
-
62
-
63
-
64
-
65
-
66
-
67
-
68
-
69
-
70
-
71
-
72
-
73
-
74
-
75
-
76
-
77
-
78
-
79
-
80
 |
 |
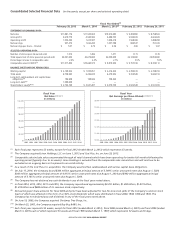
Fiscal Year Ended
(1)
February 28, 2015 March 1, 2014 March 2, 2013
(2)
February 25, 2012 February 26, 2011
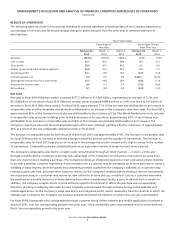
STATEMENT OF EARNINGS DATA:
Net sales $11,881,176 $11,503,963 $10,914,585 $ 9,499,890 $ 8,758,503
Gross profit 4,619,779 4,565,582 4,388,755 3,930,933 3,622,929
Operating profit 1,554,293 1,614,587 1,638,218 1,568,369 1,288,458
Net earnings 957,474 1,022,290 1,037,788 989,537 791,333
Net earnings per share − Diluted $ 5.07 $ 4.79 $ 4.56 $ 4.06 $ 3.07
SELECTED OPERATING DATA:
Number of stores open (at period end) 1,513 1,496 1,471 1,173 1,139
Total square feet of store space (at period end) 43,041,000 42,619,000 42,030,000 36,125,000 35,055,000
Percentage increase in comparable sales 2.4% 2.4% 2.7% 5.9% 7.8%
Comparable sales (in 000’s)
(3)
$11,517,454 $10,660,573 $ 9,819,904 $ 9,157,183 $ 8,339,112
BALANCE SHEET DATA (AT PERIOD END):
Working capital $ 2,140,922 $ 1,953,851 $ 2,216,323 $ 2,760,619 $ 2,748,763
Total assets 6,758,993 6,356,033 6,279,952 5,724,546 5,646,193
Long-term sale/leaseback and capital lease
obligations
(4)
106,948 108,046 108,364 — —
Long-term debt
(5)
1,500,000 — — — —
Shareholders’ equity
(6)(7)
$ 2,743,190 $ 3,941,287 $ 4,079,730 $ 3,922,528 $ 3,931,659
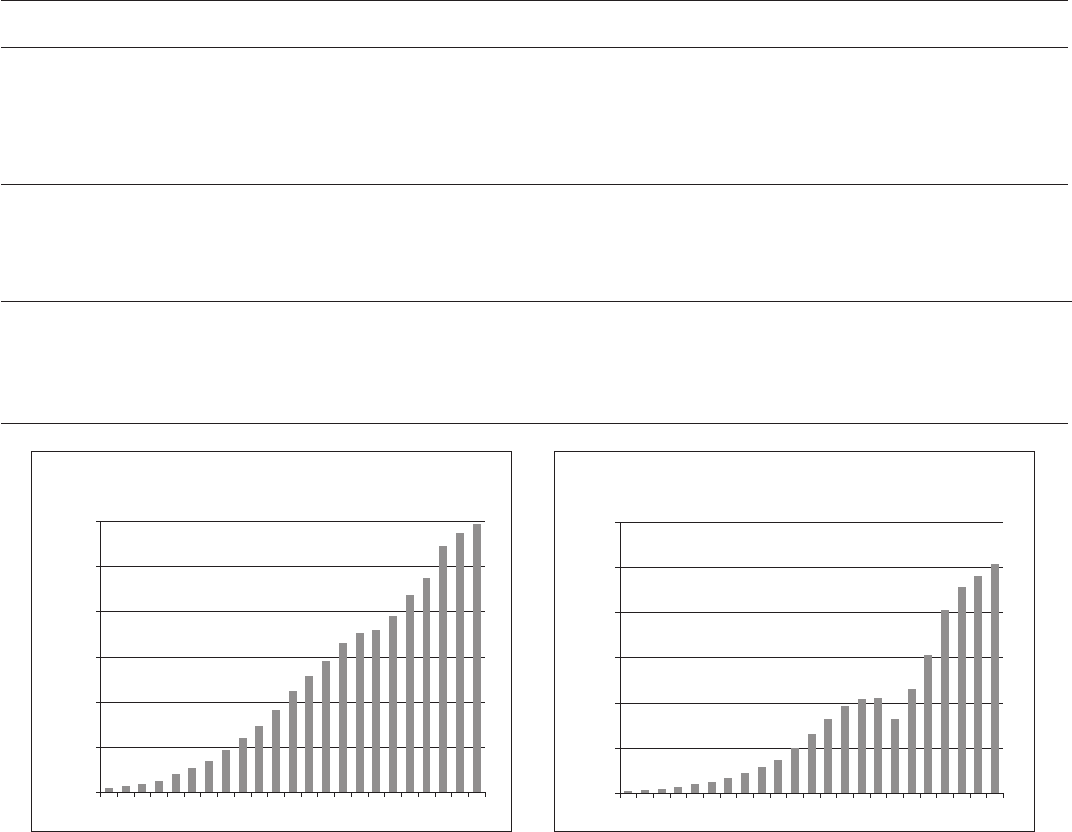
Fiscal Year
Net Sales
(in millions)
1992 1994 1996 1998 2000 2002 2004 2006 2008 2010 2012 2014
$0
$2,000
$4,000
$6,000
$8,000
$10,000
$12,000
1992 1994 1996 1998 2000 2002 2004 2006 2008 2010 2012 2014
Fiscal Year
Net Earnings per Share-Diluted
(in dollars)
$0.00
$1.00
$2.00
$3.00
$4.00
$5.00
$6.00
(2)(9)(10)(11) (2)(8)(9)(10)(11)
(1)
Each fiscal year represents 52 weeks, except for fiscal 2012 (ended March 2, 2013) which represents 53 weeks.
(2)
The Company acquired Linen Holdings, LLC. on June 1, 2012 and Cost Plus, Inc. on June 29, 2012.
(3)
Comparable sales include sales consummated through all retail channels which have been operating for twelve full months following the
opening period (typically four to six weeks). Linen Holdings is excluded from the comparable sales calculations and will continue to be
excluded on an ongoing basis as it represents non-retail activity.
(4)
As a result of the Cost Plus, Inc. acquisition, the Company assumed two sale/leaseback and various capital lease obligations.
(5)
On July 17, 2014, the Company issued $300 million aggregate principal amount of 3.749% senior unsecured notes due August 1, 2024,
$300 million aggregate principal amount of 4.915% senior unsecured notes due August 1, 2034 and $900 million aggregate principal
amount of 5.165% senior unsecured notes due August 1, 2044.
(6)
The Company has not declared any cash dividends in any of the fiscal years noted above.
(7)
In fiscal 2014, 2013, 2012, 2011 and 2010, the Company repurchased approximately $2.251 billion, $1.284 billion, $1.001 billion,
$1.218 billion and $688 million of its common stock, respectively.
(8)
Net earnings per share amounts for fiscal 2000 and prior have been adjusted for two-for-one stock splits of the Company’s common stock
(each of which was effected in the form of a 100% stock dividend), which were distributed in fiscal 2000, 1998, 1996 and 1993. The
Company has not declared any cash dividends in any of the fiscal years noted above.
(9)
On June 19, 2003, the Company acquired Christmas Tree Shops, Inc.
(10)
On March 22, 2007, the Company acquired Buy Buy BABY, Inc.
(11)
Each fiscal year represents 52 weeks, except for fiscal 2012 (ended March 2, 2013), fiscal 2006 (ended March 3, 2007) and fiscal 2000 (ended
March 3, 2001) each of which represent 53 weeks and fiscal 1996 (ended March 1, 1997) which represents 52 weeks and 6 days.
Consolidated Selected Financial Data (in thousands, except per share and selected operating data)
BED BATH & BEYOND 2014 ANNUAL REPORT